32 Classification Metrics
Choice of metrics influences how the performance of the machine learning algorithm is measured and compared and eventually the effectiveness of the model.
Classification Metrics
Classification Accuracy
The number of correct predictions made as a ratio of all predictions made.
Logarithmic Loss
A performance metric for evaluating the predictions of probabilities of membership to a given class.
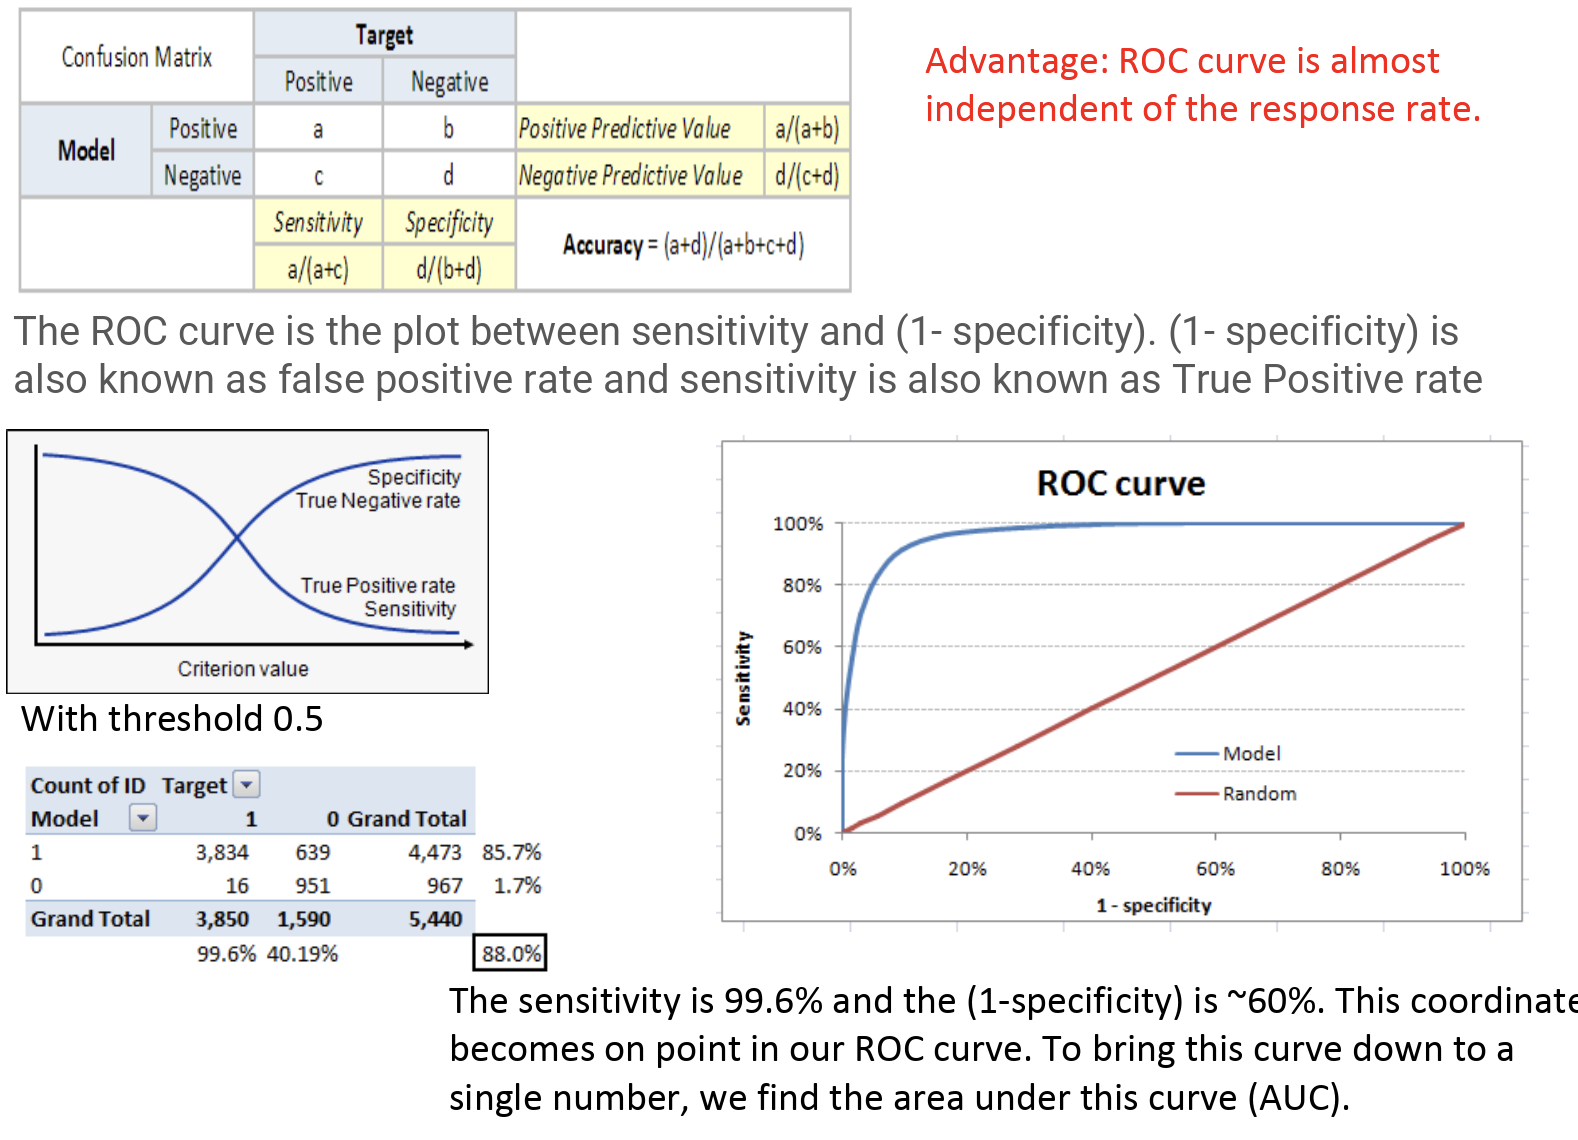
Area Under ROC Curve
A performance metric for binary classification problems.
The AUC represents a model’s ability to discriminate between positive and negative classes. An area of 1.0 represents a model that made all predictions perfectly. An area of 0.5 represents a model as good as random. ROC can be broken down into sensitivity and specificity.
Sensitivity is the true positive rate also called the recall. It is the number of instances from the positive class that actually predicted correctly.
Specificity is also called the true negative rate. It is the number of instances from the negative class that were actually predicted correctly.
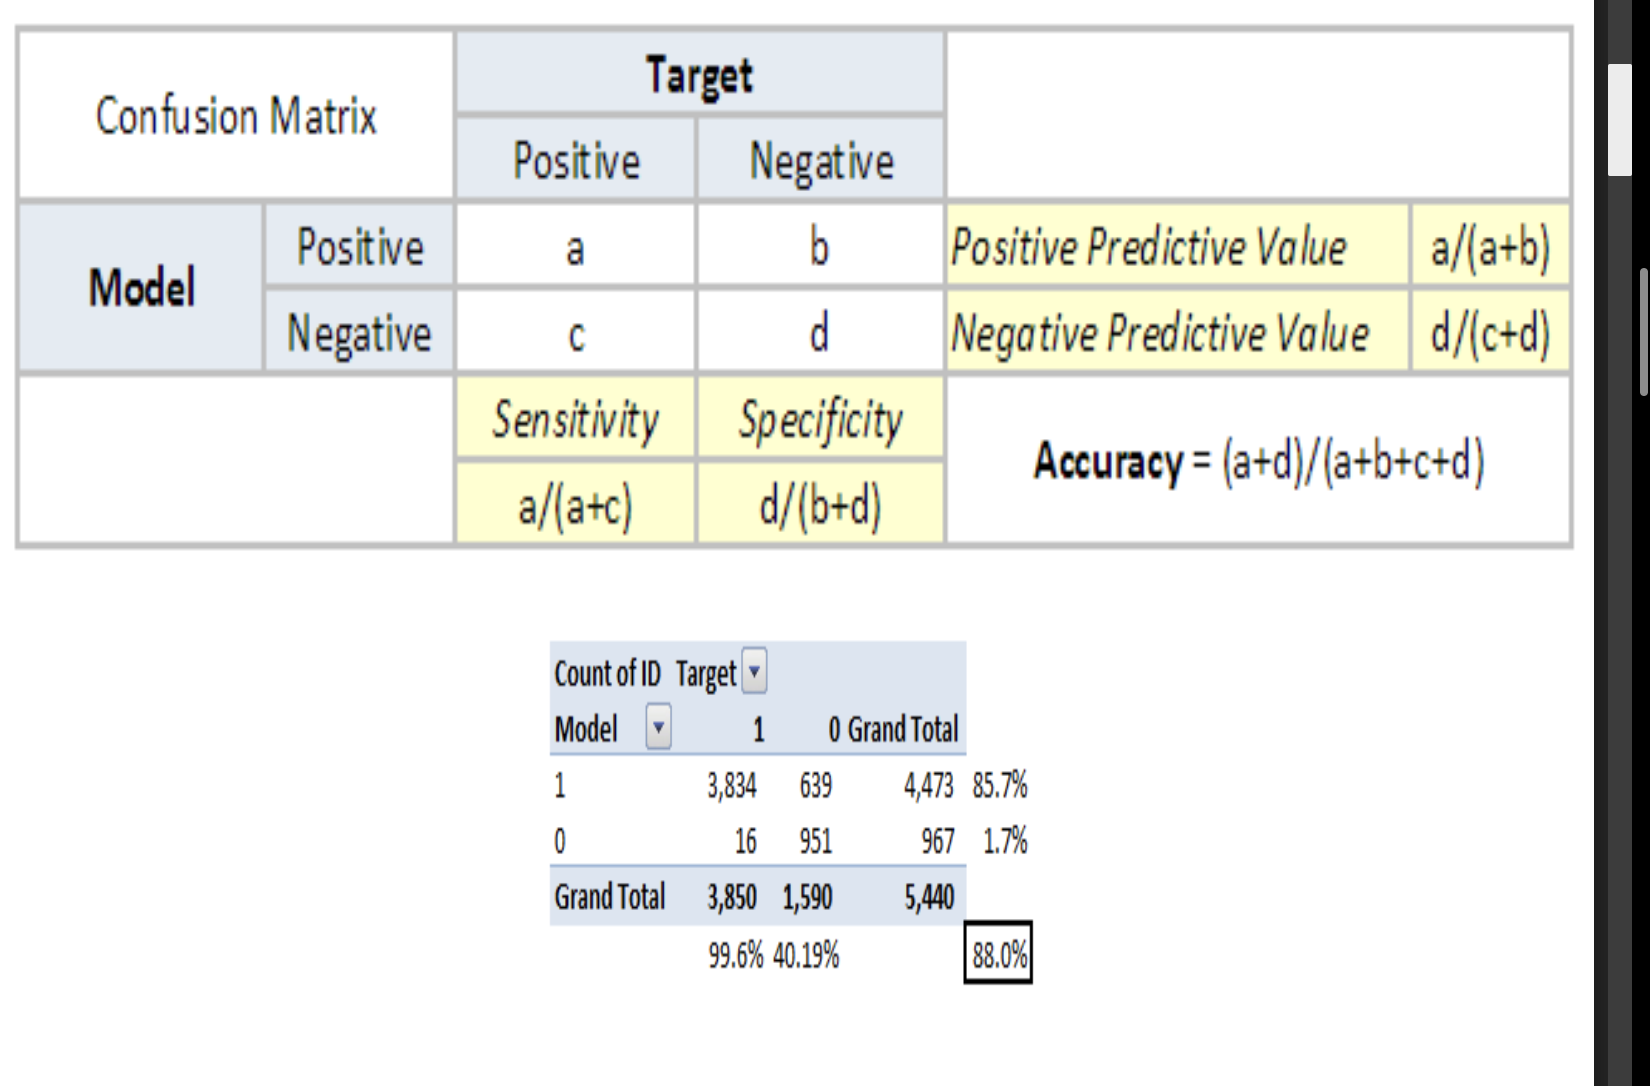
Confusion Matrix
A confusion matrix is an N X N matrix, where N is the number of classes being predicted.
Accuracy: The proportion of the total number of predictions that were correct.
Positive Predictive Value / Precision: The proportion of positive cases that were correctly identified.
Negative Predictive Value: The proportion of negative cases that were correctly identified.
Sensitivity: The proportion of actual positive cases that are correctly identified.
Specificity: The proportion of actual negative cases that are correctly identified.