
Learning Objectives
Create outputs for key variables, observe how filters and slicers impact outputs.
Process: Use the Selection, Visualization, and Fields panes to summarize and analyze data.
Step 1: Open your EIA_Imports_2014-18_Lab1A.pbix file or open the Completed_EIA_Imports_2014-18_Lab1A.pbix file you can download from Blackboard > XYZ.
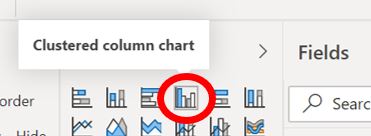
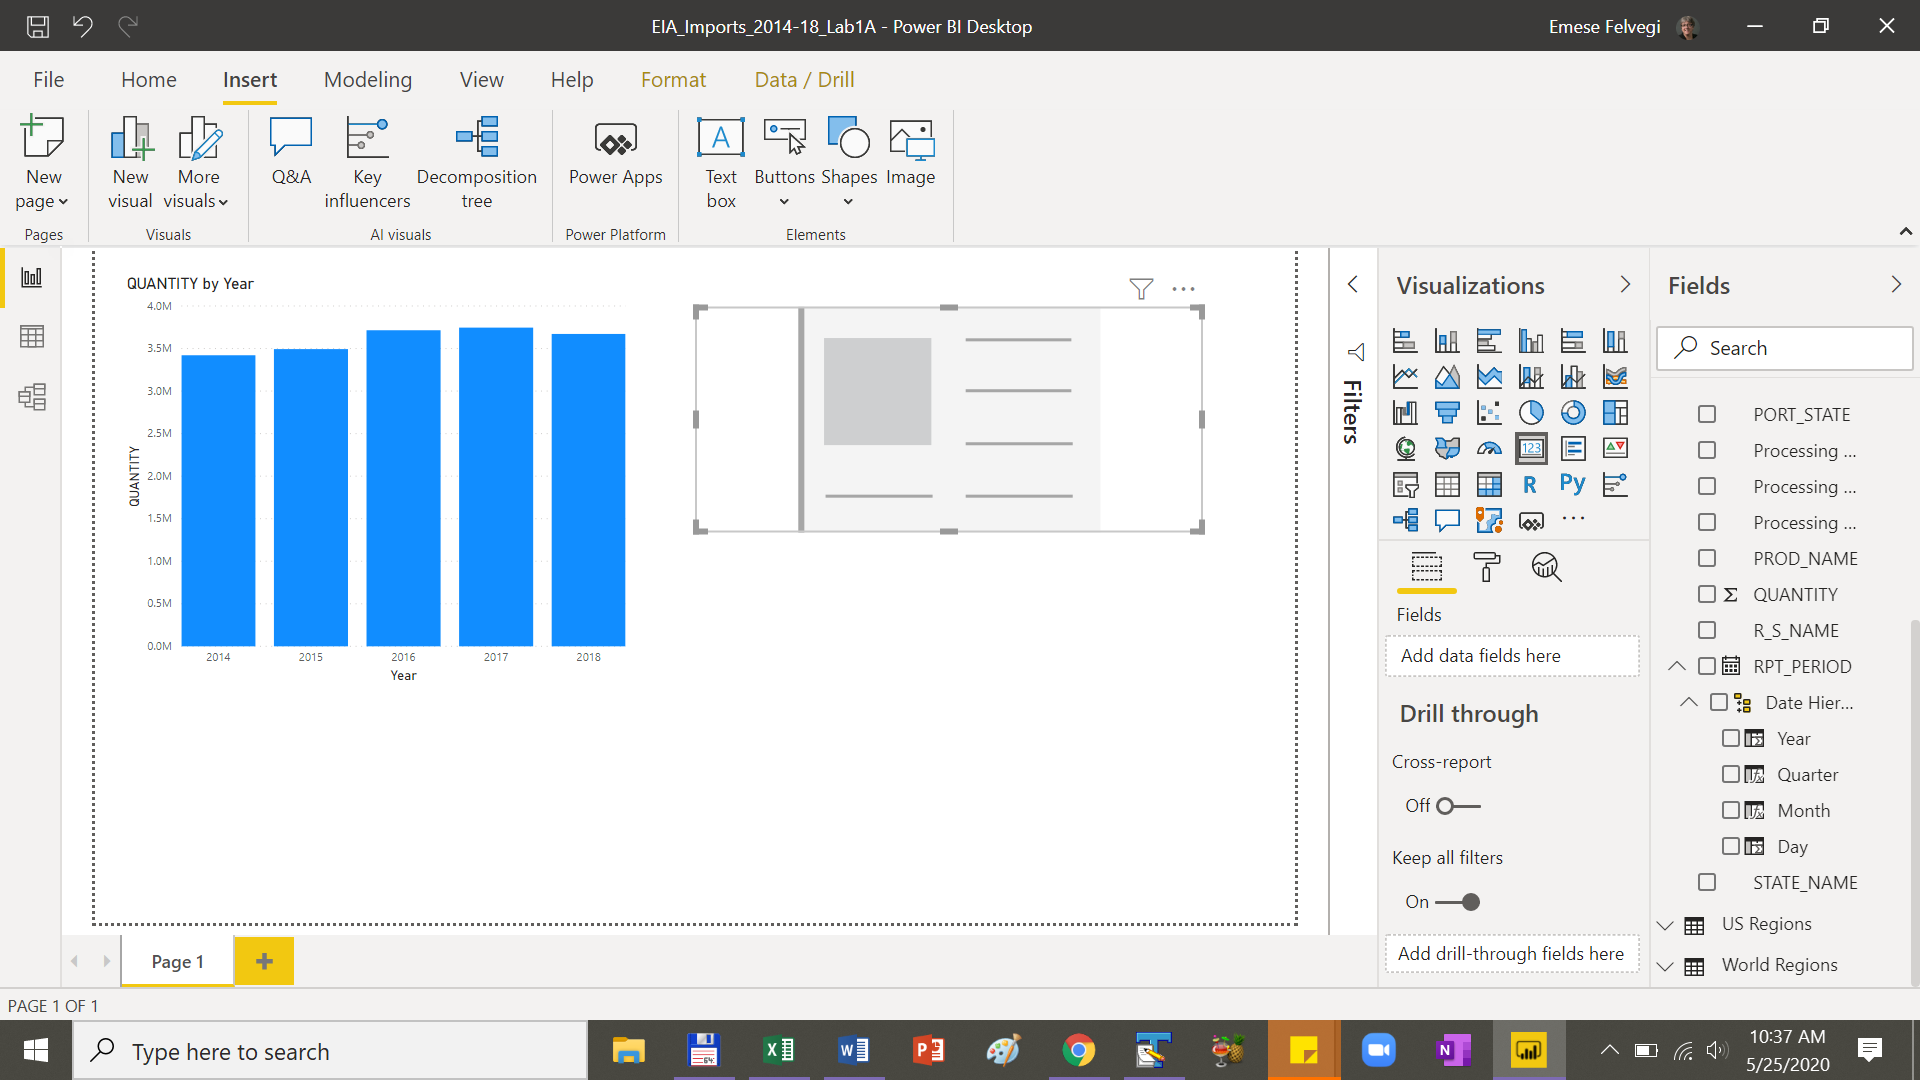
Step 2: Under the Visualization pane, select Clustered column chart icon.
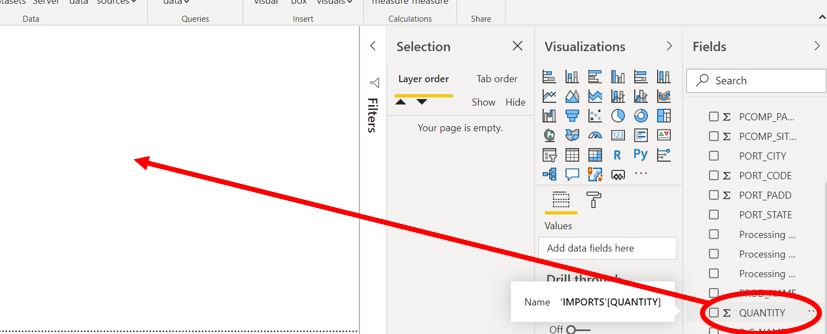
Step 3: Locate the QUANTITY field name in the Fields pane on the right and drag it onto the canvas:
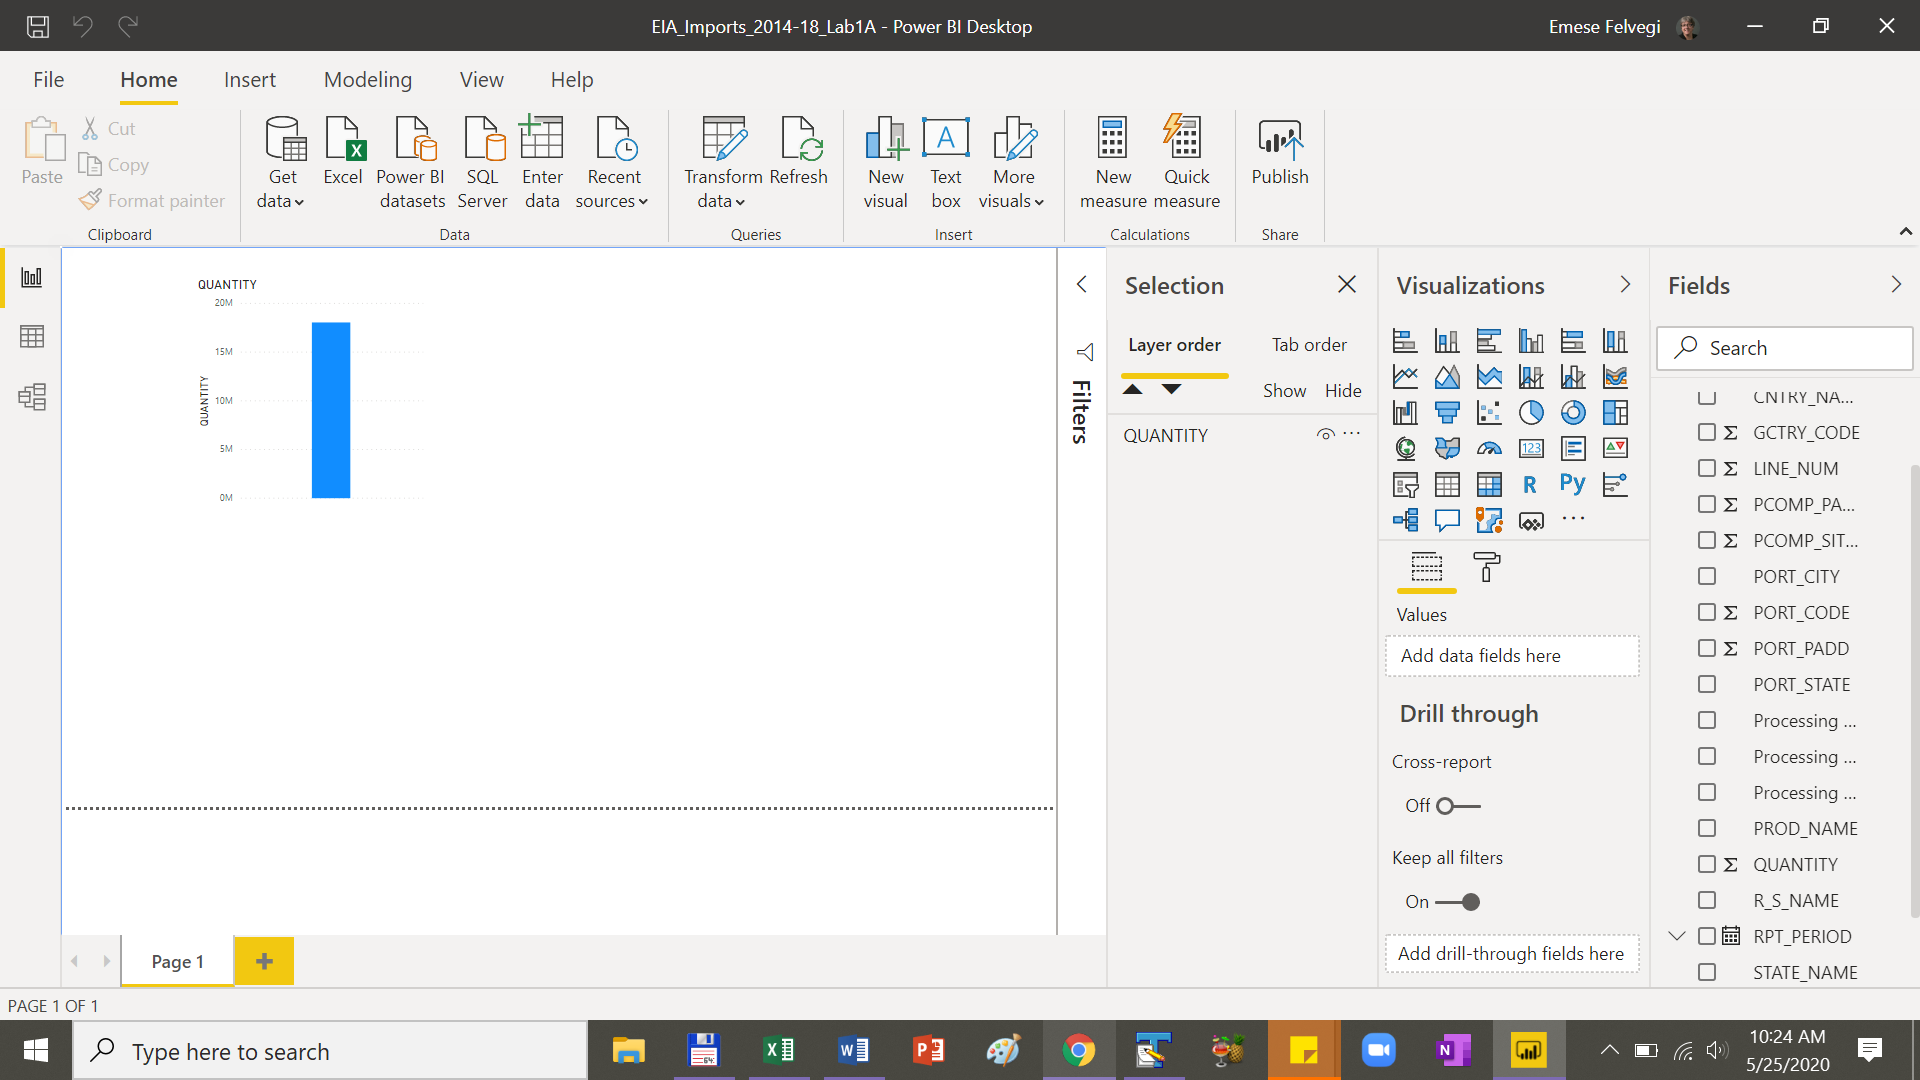
Your output should look like this:
Exercises
Answer the following question based on the chart by hovering over it to display the summary value for QUANTITY.
Q: What was the overall QUANTITY of products that were imported into the Unites States between 2014 and 2018?
A: 18,046,358 thousands of barrels
Step 4: In the Fields pane on the right, expand the RPT_PERIOD field and drag the Year field onto the column chart. Under visualization, you will have RPT_PERIOD > Year under your Axis, QUANTITY under values. Your output should look like the item below: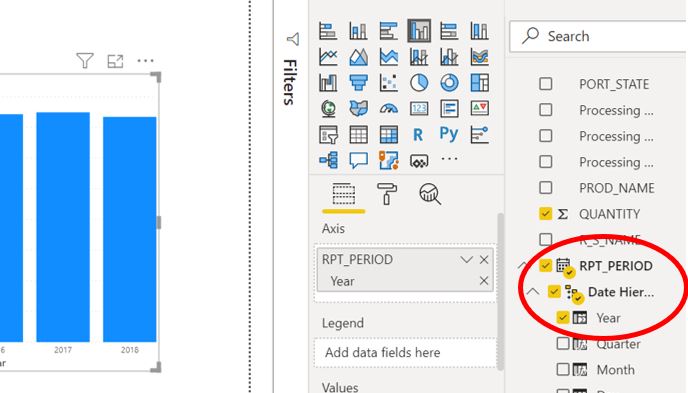
Exercises
Answer the following question based on the clustered column chart by hovering over it to display the summary values for QUANTITY for the selected year.
Q: What was the overall QUANTITY of products that were imported into the Unites States in 2015?
A: 3,493,218 thousands of barrels
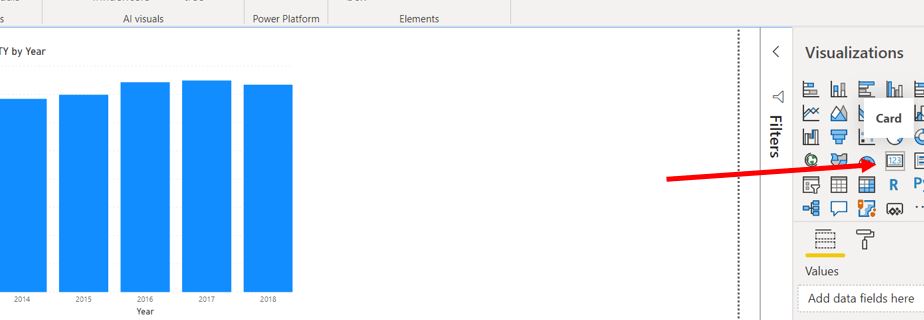
Step 5: Under Visualization, add a new Card to your canvas.
Your canvas should have a new card appear as shown below:
Step 6: From the Fields pane on the right, drag the QUANTITY field, and then the Year field onto the Card. Your output should look like as shown below with a small summary data table appear next to your clustered column chart. If the Card Visualization does not work, use a Table card.
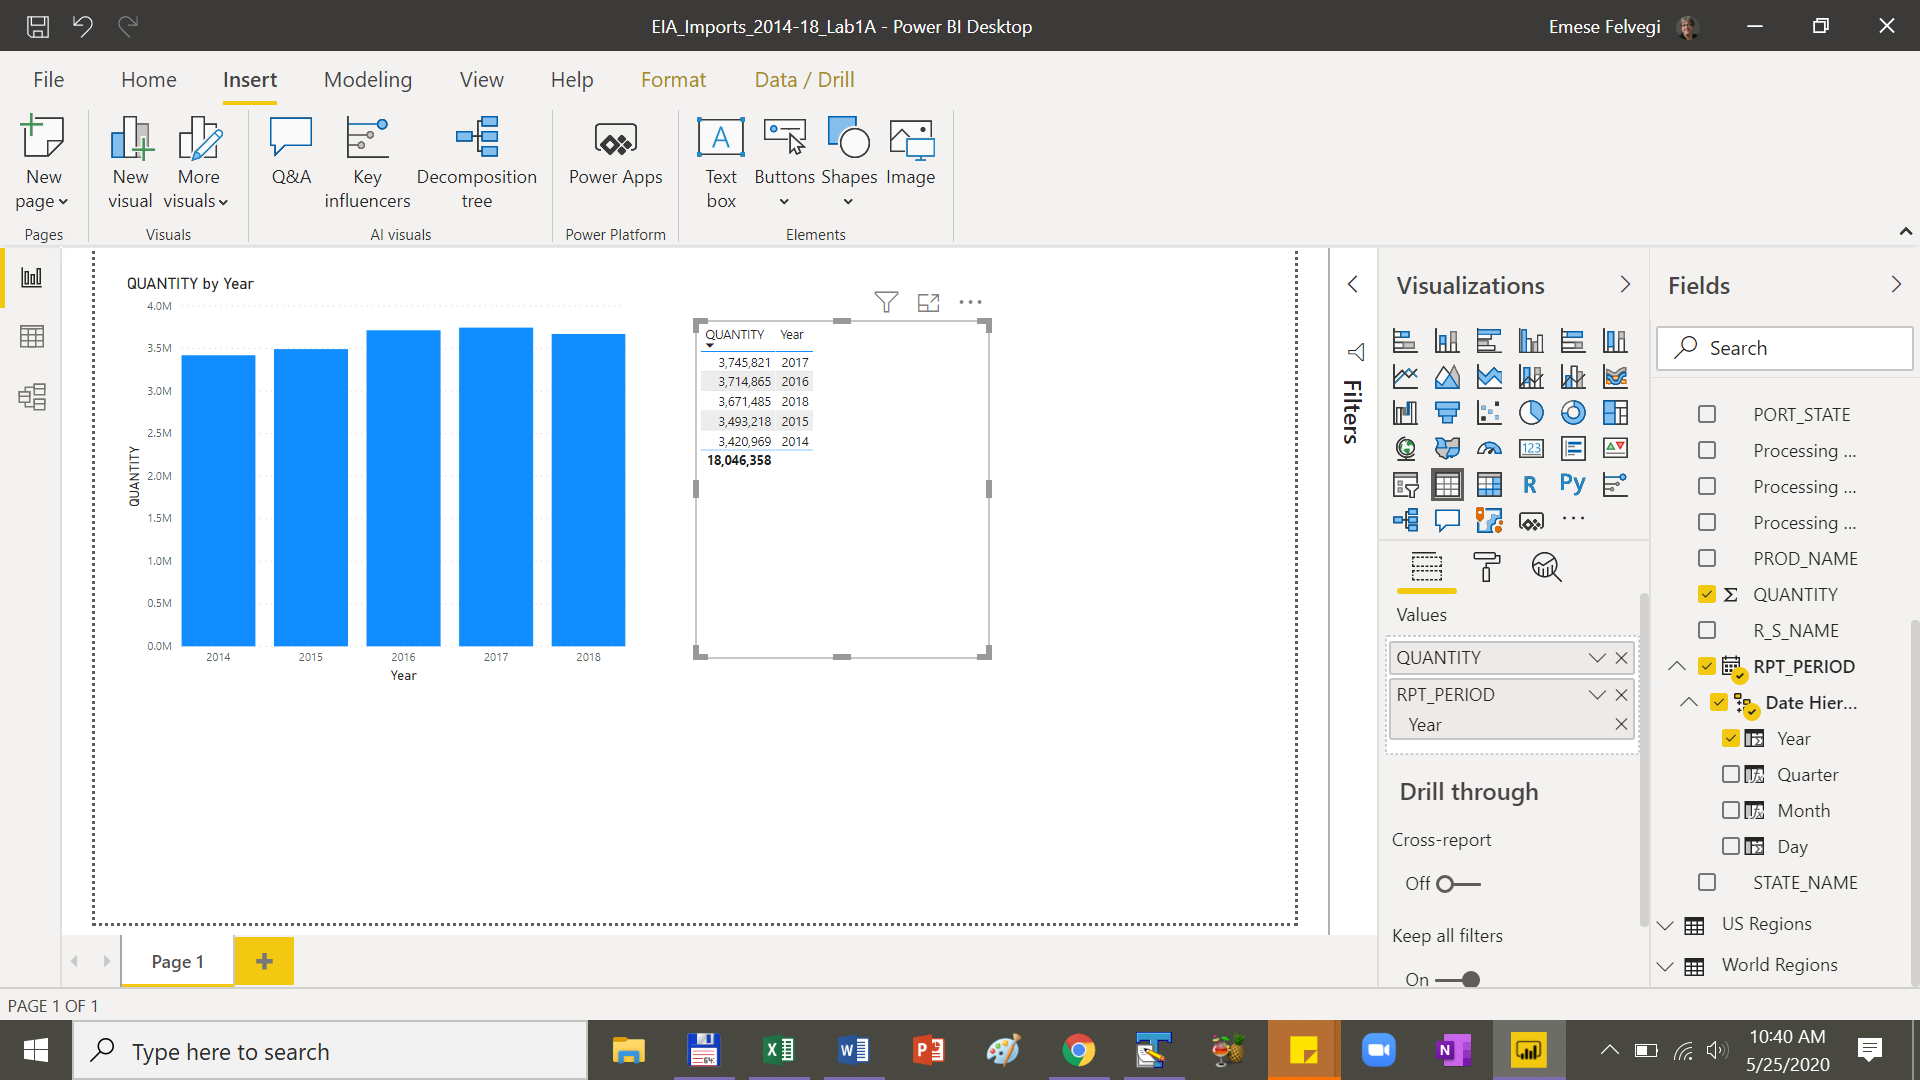
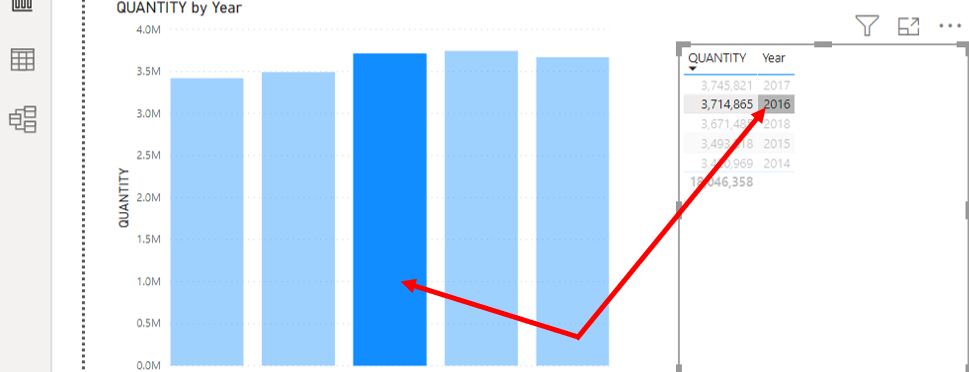
Step 7: Use the Year field in the table to cycle through and select each year. Note how the Year field in this card acts as a filter for your data highlighting the year in the clustered column chart to the left.
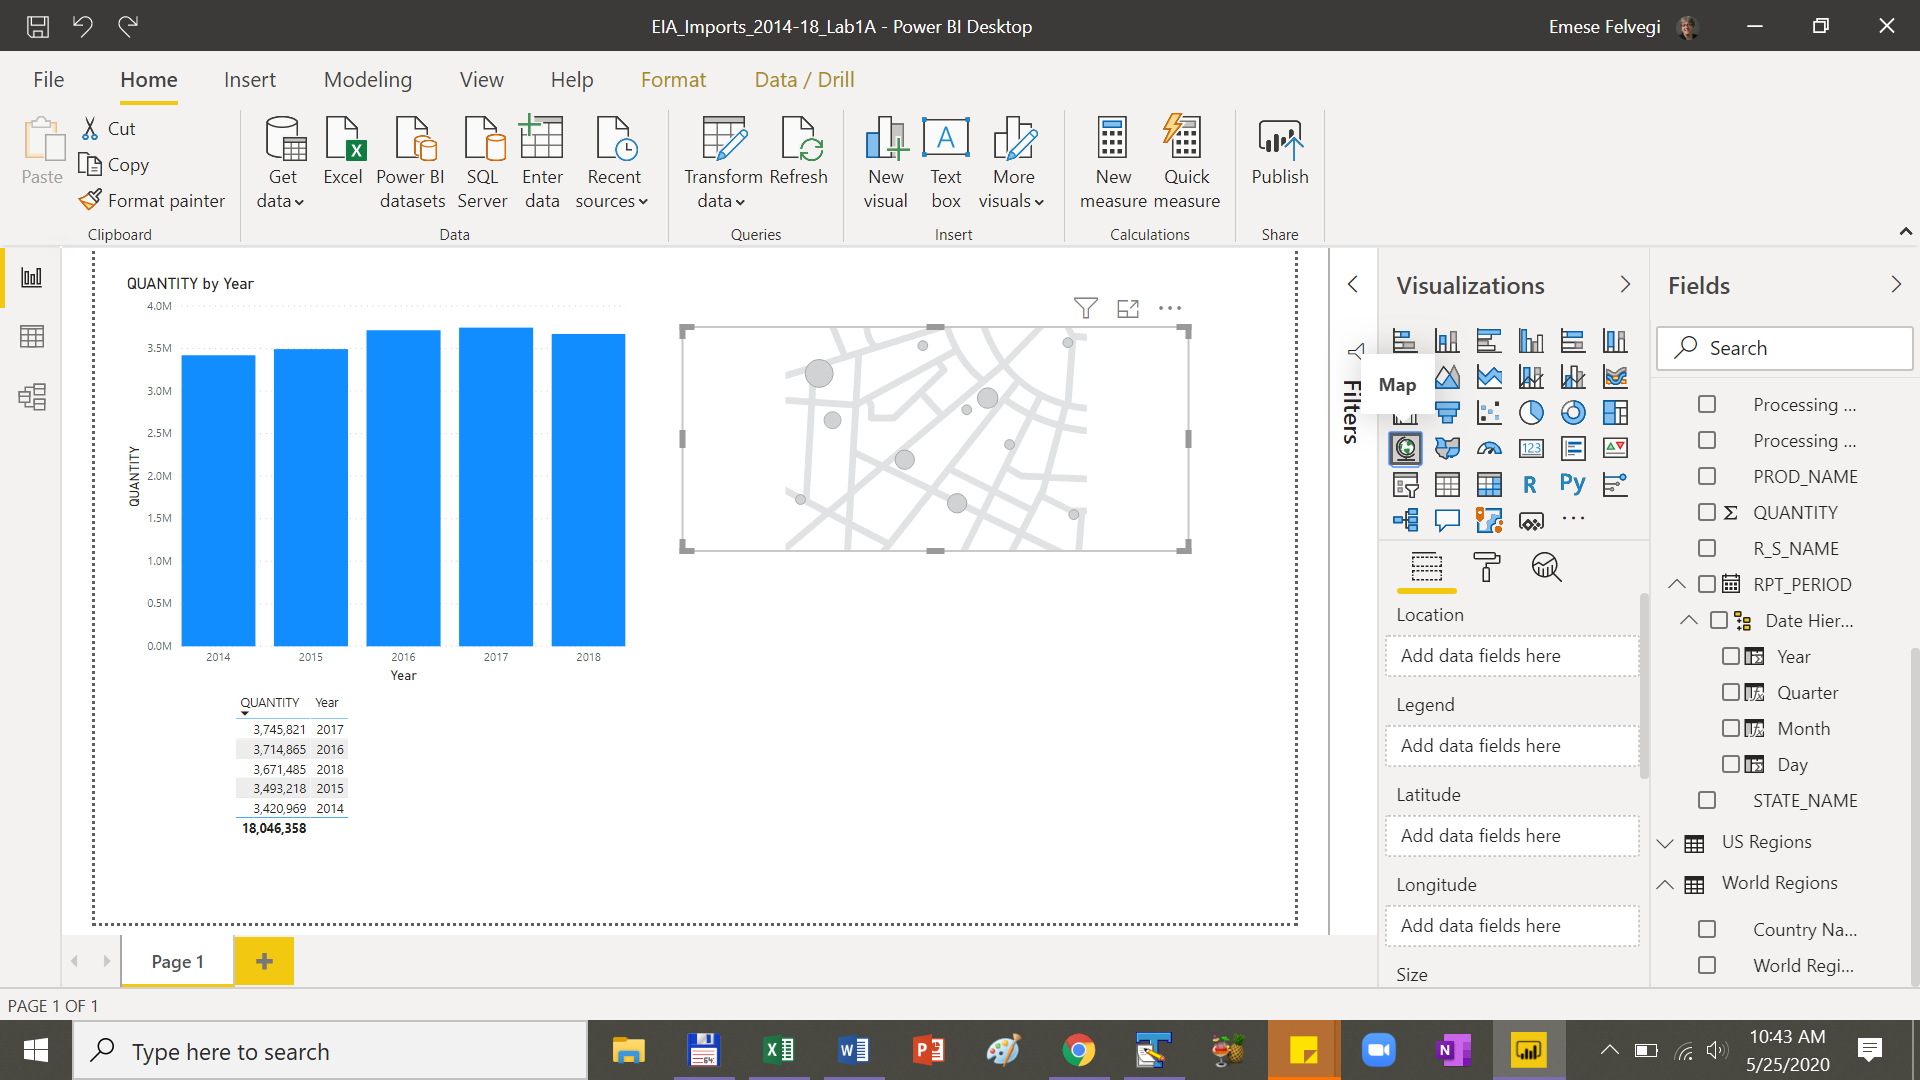
Step 8: Move your data table below the clustered column chart. Add a new Card and select the Map visualization. Your canvas should look as shown below:
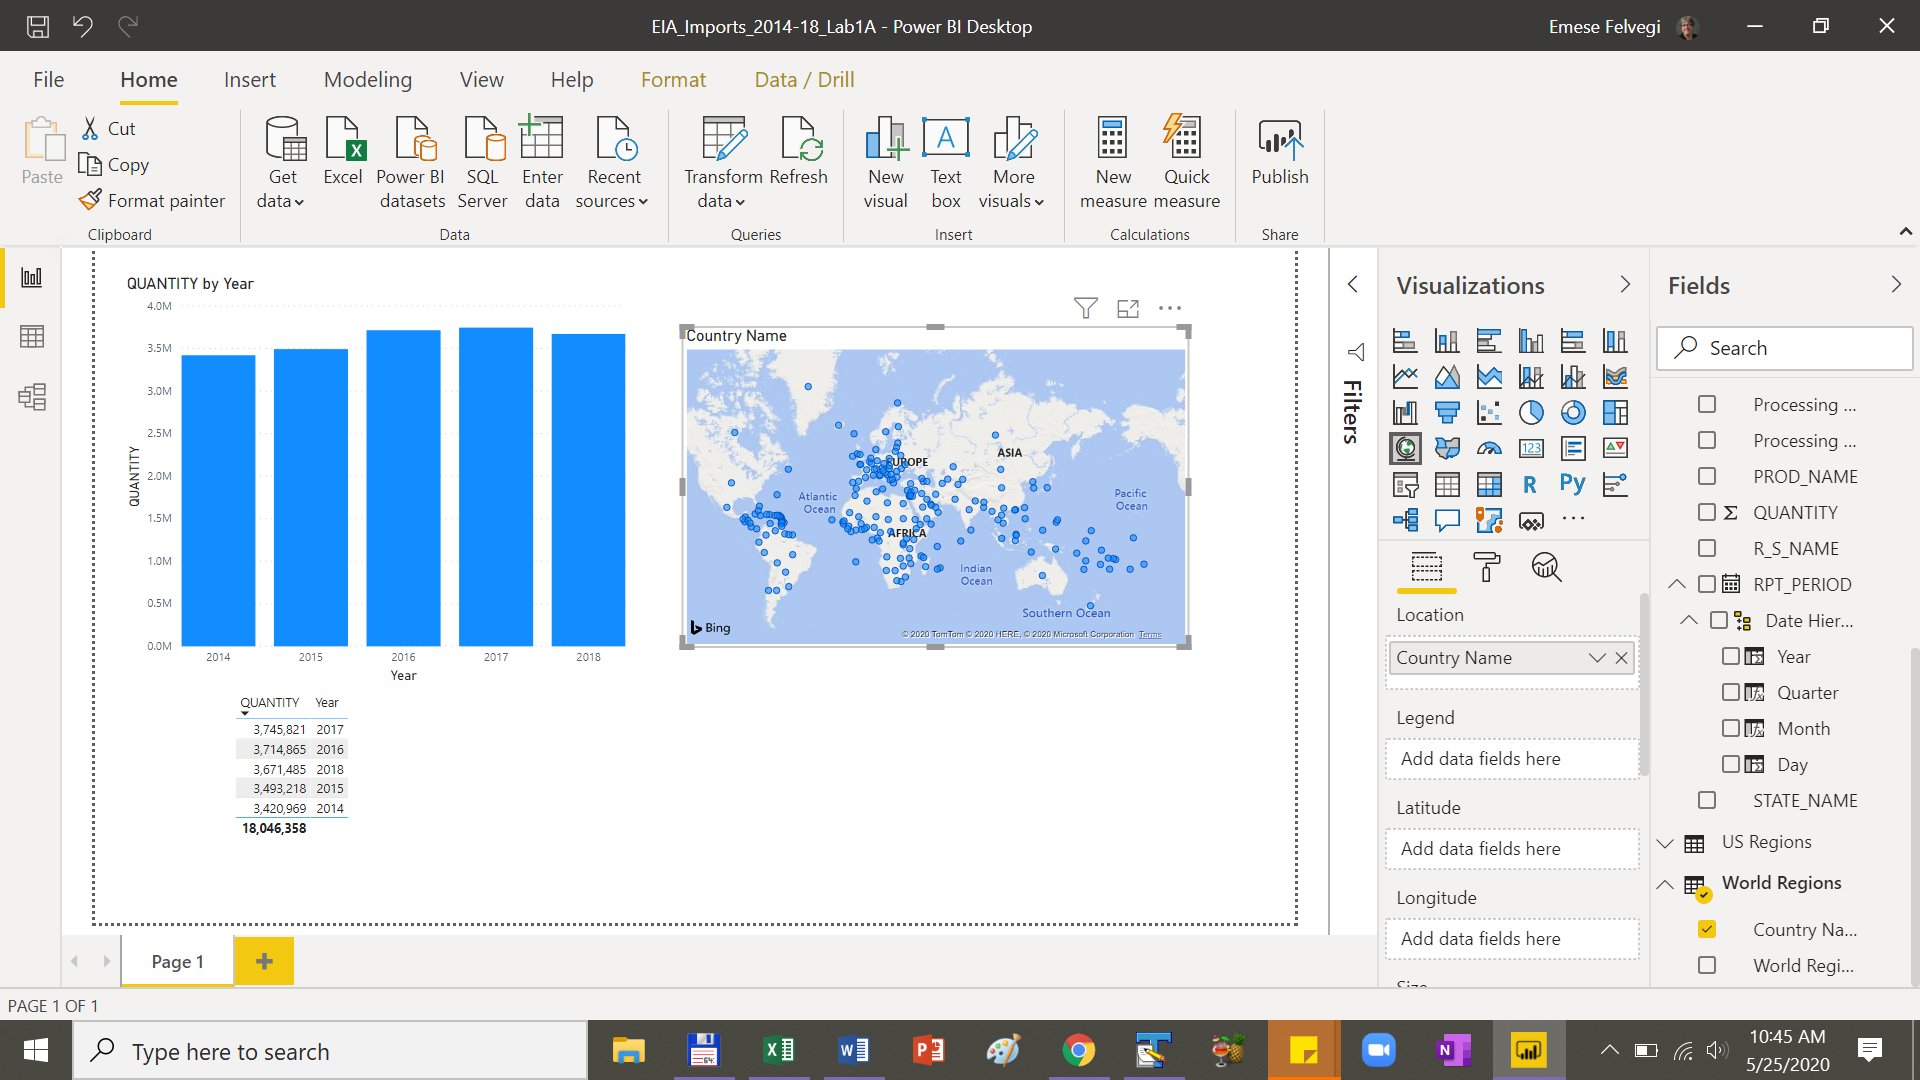
Step 9: From the Fields pane, drag the World Regions > Country Name field into the new card. Your canvas should look as shown below:
Exercises
Q: Is/are there a region(s) that seem(s) the densest in default view on the map considering Exporting countries?
A: Central America, Western Africa, Southern Europe
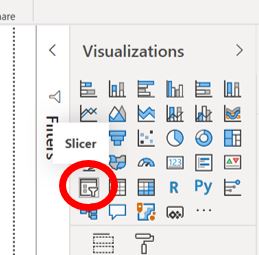
Step 10: From under Visualizations, Add a Slicer to your canvas.
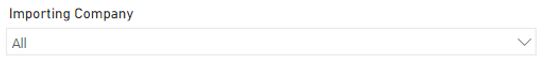
Step 11: From the Fields pane, drag Importing Company to the slicer. Click the dropdown icon in the top right corner of the slicer and select the Dropdown option.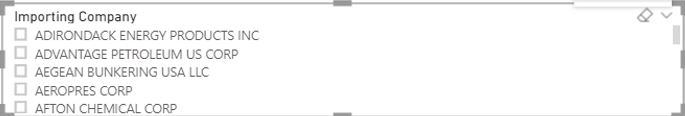
Your slicer should look like so:
Step 12: Add another Slicer and drag Product Name onto it. Change it to Dropdown style and filter for Crude Oil.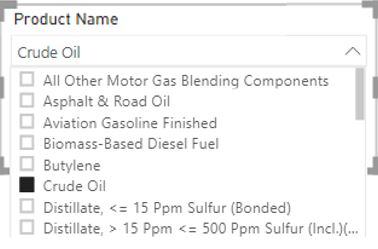
Exercises
Answer the following question based on the changes you observe in your QUANTITY/Year output.
Q: What is the overall QUANTITY of Crude Oil imported into the Unites States by CHEVRON USA INC?
A: 1,185,989 thousand of barrels
Answer the following question based on the changes you observe in your output.
Q: What is the QUANTITY of Crude Oil imported into the Unites States by CHEVRON USA INC in 2017?
A: 234,623 thousand of barrels
Answer the following question based on the changes you observe in your output.
Q: Which year shows the highest QUANTITY of Crude Oil imported into the Unites States by CHEVRON USA INC?
A: 2016
