
18 PivotTables & PivotCharts with CFPB Auto Loan Complaint Data
 This chapter is a collaboration with Péter Felvégi, an Operational Risk Professional who served as Vice President of Operational Risk at JPMorgan Chase & Co. and as Senior Operational Risk Officer for Americas at Standard Chartered Bank in New York, NY. Péter holds a BS in Management with a Concentration in Finance and Economics from St. Francis College in Brooklyn, NY.
 Key points about Auto Loans
- 91.7% of households had at least one vehicle in 2021. Only 8.3% of households did not have a vehicle. (US Census, Forbes)
- There are more than 275 million cars on the road in the U.S. (CNBC.com)
- “Outside of purchasing your first home, a new car is the second-largest purchase for most people,” […] “Given the transaction prices and vehicle prices today, financing is required to buy these vehicles.” (CNBC.com)
- More than 100 million Americans have a car loan, and auto loan debt in the U.S. currently stands at $1.5 trillion — a record high. (CNC.com)
Professionals Who Deal with Auto Loans
Several professions deal with auto loan data. Individuals working for financial institutions, automotive companies, credit bureaus, or other related organizations.
- Risk Managers
- Analysts
- Loan Officers
- Compliance Officers
- IT or Data Security Professionals
- Customer Service Reps
Public Auto Loan Complaint Data from the CFPB
The Consumer Financial Protection Bureau (CFPB) is a U.S. government agency dedicated to making sure by banks, lenders and other financial institutions treat all fairly (CFPB).
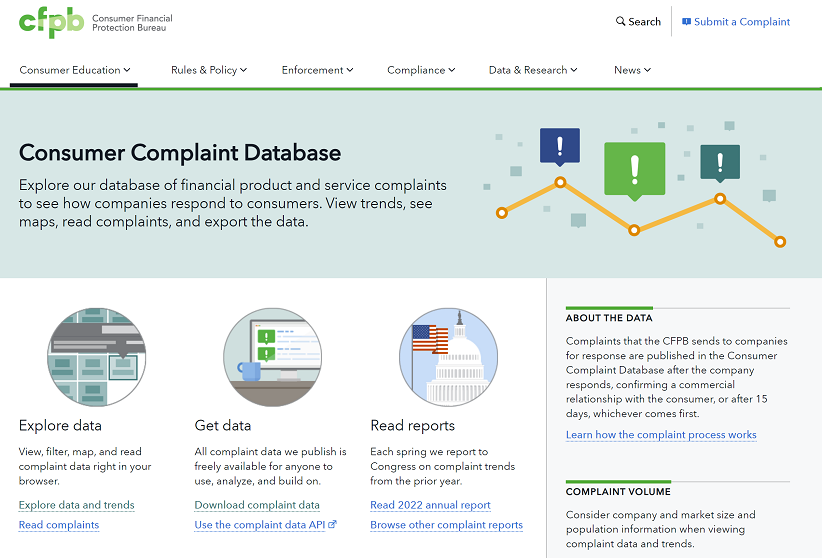
The CFPB’s Consumer Complaint Database allows users to see “financial product and service complaints” […] “view trends, see maps, read complaints, and export the data (CFPB).”
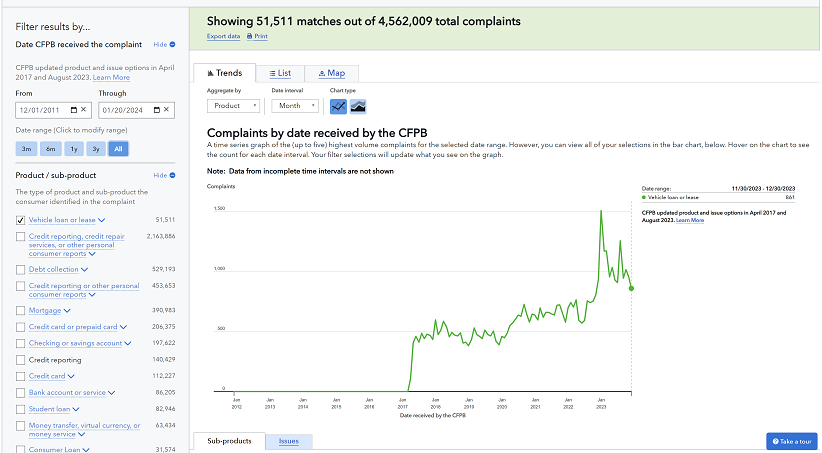
The data set as of 12/2023: 50,425 matches for Auto Loan complaints available for download in an Excel file (out of 4,413,134 total complaints).
Related Data Processing Tasks at the workplace
- Interpret the Data Dictionary and the data structure.
- Explore the data file, examine data types.
- Plan, create, and edit a PivotTable.
- Plan, create, and edit PivotCharts.
- Manipulate PivotTable Fields, use % of Grand Totals.
- Sort and rearrange the data, return Top N results.
- Use Slicers to update outputs.
- Create a compelling dashboard for reporting purposes.
Related Data Processing Tasks in the Curriculum
- Interpret PivotTable outputs.
- Interpret and evaluate PivotChart outputs.
- Select optimal table and chart options.
- Explain items highlighted in a dashboard.
- Summarize outputs in a brief narrative.
- Present summary report in a Word document.
- Create a PowerPoint slide deck showcasing key points.
- Audit and proof a Word document and PowerPoint deck.
Data analysis Warm-up QUESTIONS:
- What kinds of data do you expect to find in the file you downloaded from the CFPB?
- Next, open the data file. Is there a summary of info sheet?
- Is there a Data Dictionary? If it’s not included in the data file, where can you locate it?
- Do the field names make sense? What can you do if there is no data dictionary to be found?
- How much data is in the workbook: how many fields, records, cells with contents are there?
- What types of questions can you answer with the data?
- What functions do you know in Excel that will help you process data?
Explore the data with pivottables
Click anywhere in the data in the Excel file, then click INSERT > PivotTable. Insert in New Worksheet.
The PivotTable field selector will show the field names on the right side of the interface.
Now, build some summary data to find out how states, providers, and other relevant items compare!
You can create PivotTables to calculate the following:
- Which state has the highest or lowest number of complaints?
- How many complaints are there in Texas? Is this higher or lower than you expected?
- Which Product are there the least/most complaints about?
- Which Sub-product are there the least/most complaints about?
- Which Issue are there the least/most complaints about?
- Which Company are there the least/most complaints about?
- What platform were complaints submitted via?
- What do these trends looks like over time? Is there an increase or decrease?
- Which PivotChart type is best suited to represent this data?
- Considering news of massive airbag recalls and emission scandals, do general trends parallel complaints?
