
Chapter 8: Metamorphic Rocks
Classification and Pressure-Temperature
Learning Objectives
The goals of this chapter are to:
- Classify metamorphic rocks
- Interpret metamorphic protoliths
- Evaluate pressure and temperature conditions
8.1 Introduction
Metamorphic rocks form when any pre-existing rock is altered by heat and/or pressure. The two sources of heat for metamorphism are the heat from a magma chamber and the geothermal gradient, which is the natural increase in temperature when getting deeper into the Earth. Pressure also increases with depth in the Earth, but intense pressure also occurs during tectonic plate collisions. This is why most of the world’s metamorphic rocks are found in active or ancient mountain belts. Because of this, metamorphic rocks provide geologists with information on how past tectonic processes shaped our planet.
Exercise 8.1 – Observing Metamorphic Rocks
Your instructor has provided you with a set of rocks. Continuing on our ideas of classification, sort these rocks into groups based on any criteria you want to use. Your instructor may ask you to re-classify the materials several times using different criteria.
- List the criteria you used? Why?
- Did you need to reclassify your samples? If so, which criteria changed?
8.2 Heat, Pressure, and Foliation
Heat and pressure can cause several changes in rocks, such as recrystallizing minerals, creating new minerals, and orientating minerals in a direction perpendicular to differential pressure. The orientation of minerals is the most noticeable feature when recognizing metamorphic rocks, called foliation. Heat works to “soften” minerals, allowing ions to begin migrating in and out of crystal structures. Then pressure forces the minerals to re-orientate. Heat is the most important factor, though; without heat, the rock would just break under intense pressure.
Several types of foliation are commonly seen in metamorphic rocks: gneissic banding, slaty or rock cleavage, and schistosity. As pressure increases, so does the degree of foliation. Not all metamorphic rocks exhibit foliation because some minerals change very little under metamorphic conditions (quartz, for example); these types of metamorphic rocks are called non-foliated and can be very difficult to tell apart from igneous rocks.
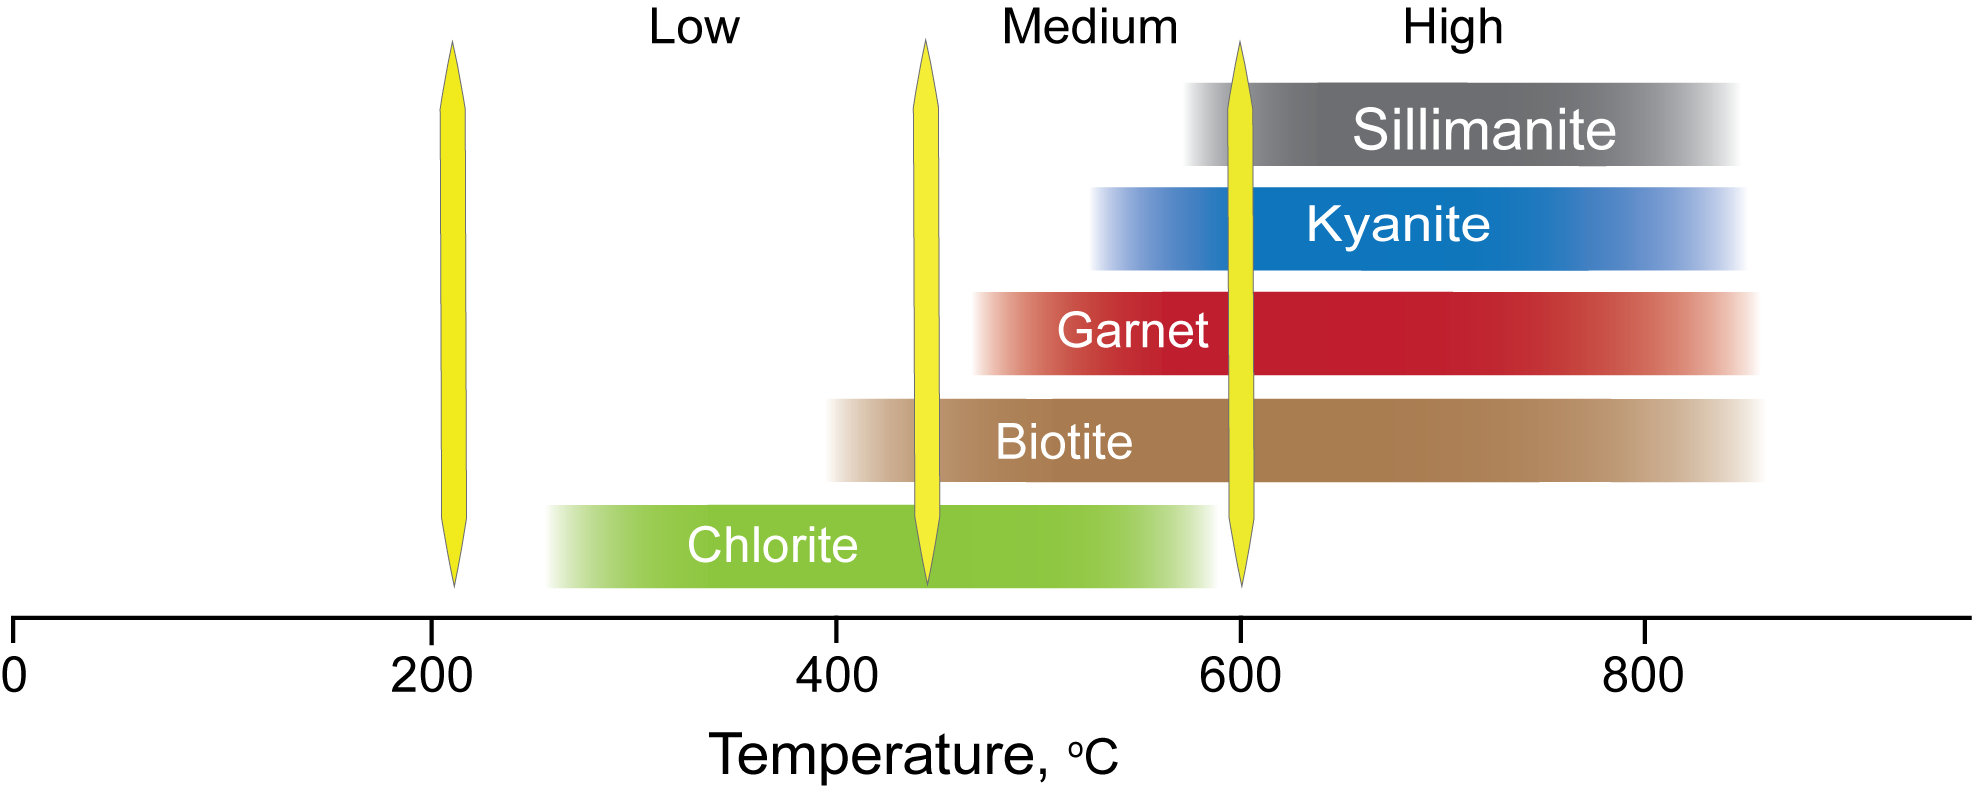
Another feature or observation that you may use for classification is the presence of certain (index) minerals. There are many more minerals in metamorphic rocks than you learned in Chapter 3. So, we will try to make this easy for you. The different metamorphic index minerals reflect the highest temperature the rock reached during metamorphism (Figure 8.2).
One more aspect of identifying metamorphic rocks is determining the maximum temperature that the rock reached. You can either use metamorphic grade or metamorphic facies. In this lab book, we will focus on relative metamorphic grade from low to high.
Exercise 8.2 – Identifying Metamorphic Rocks
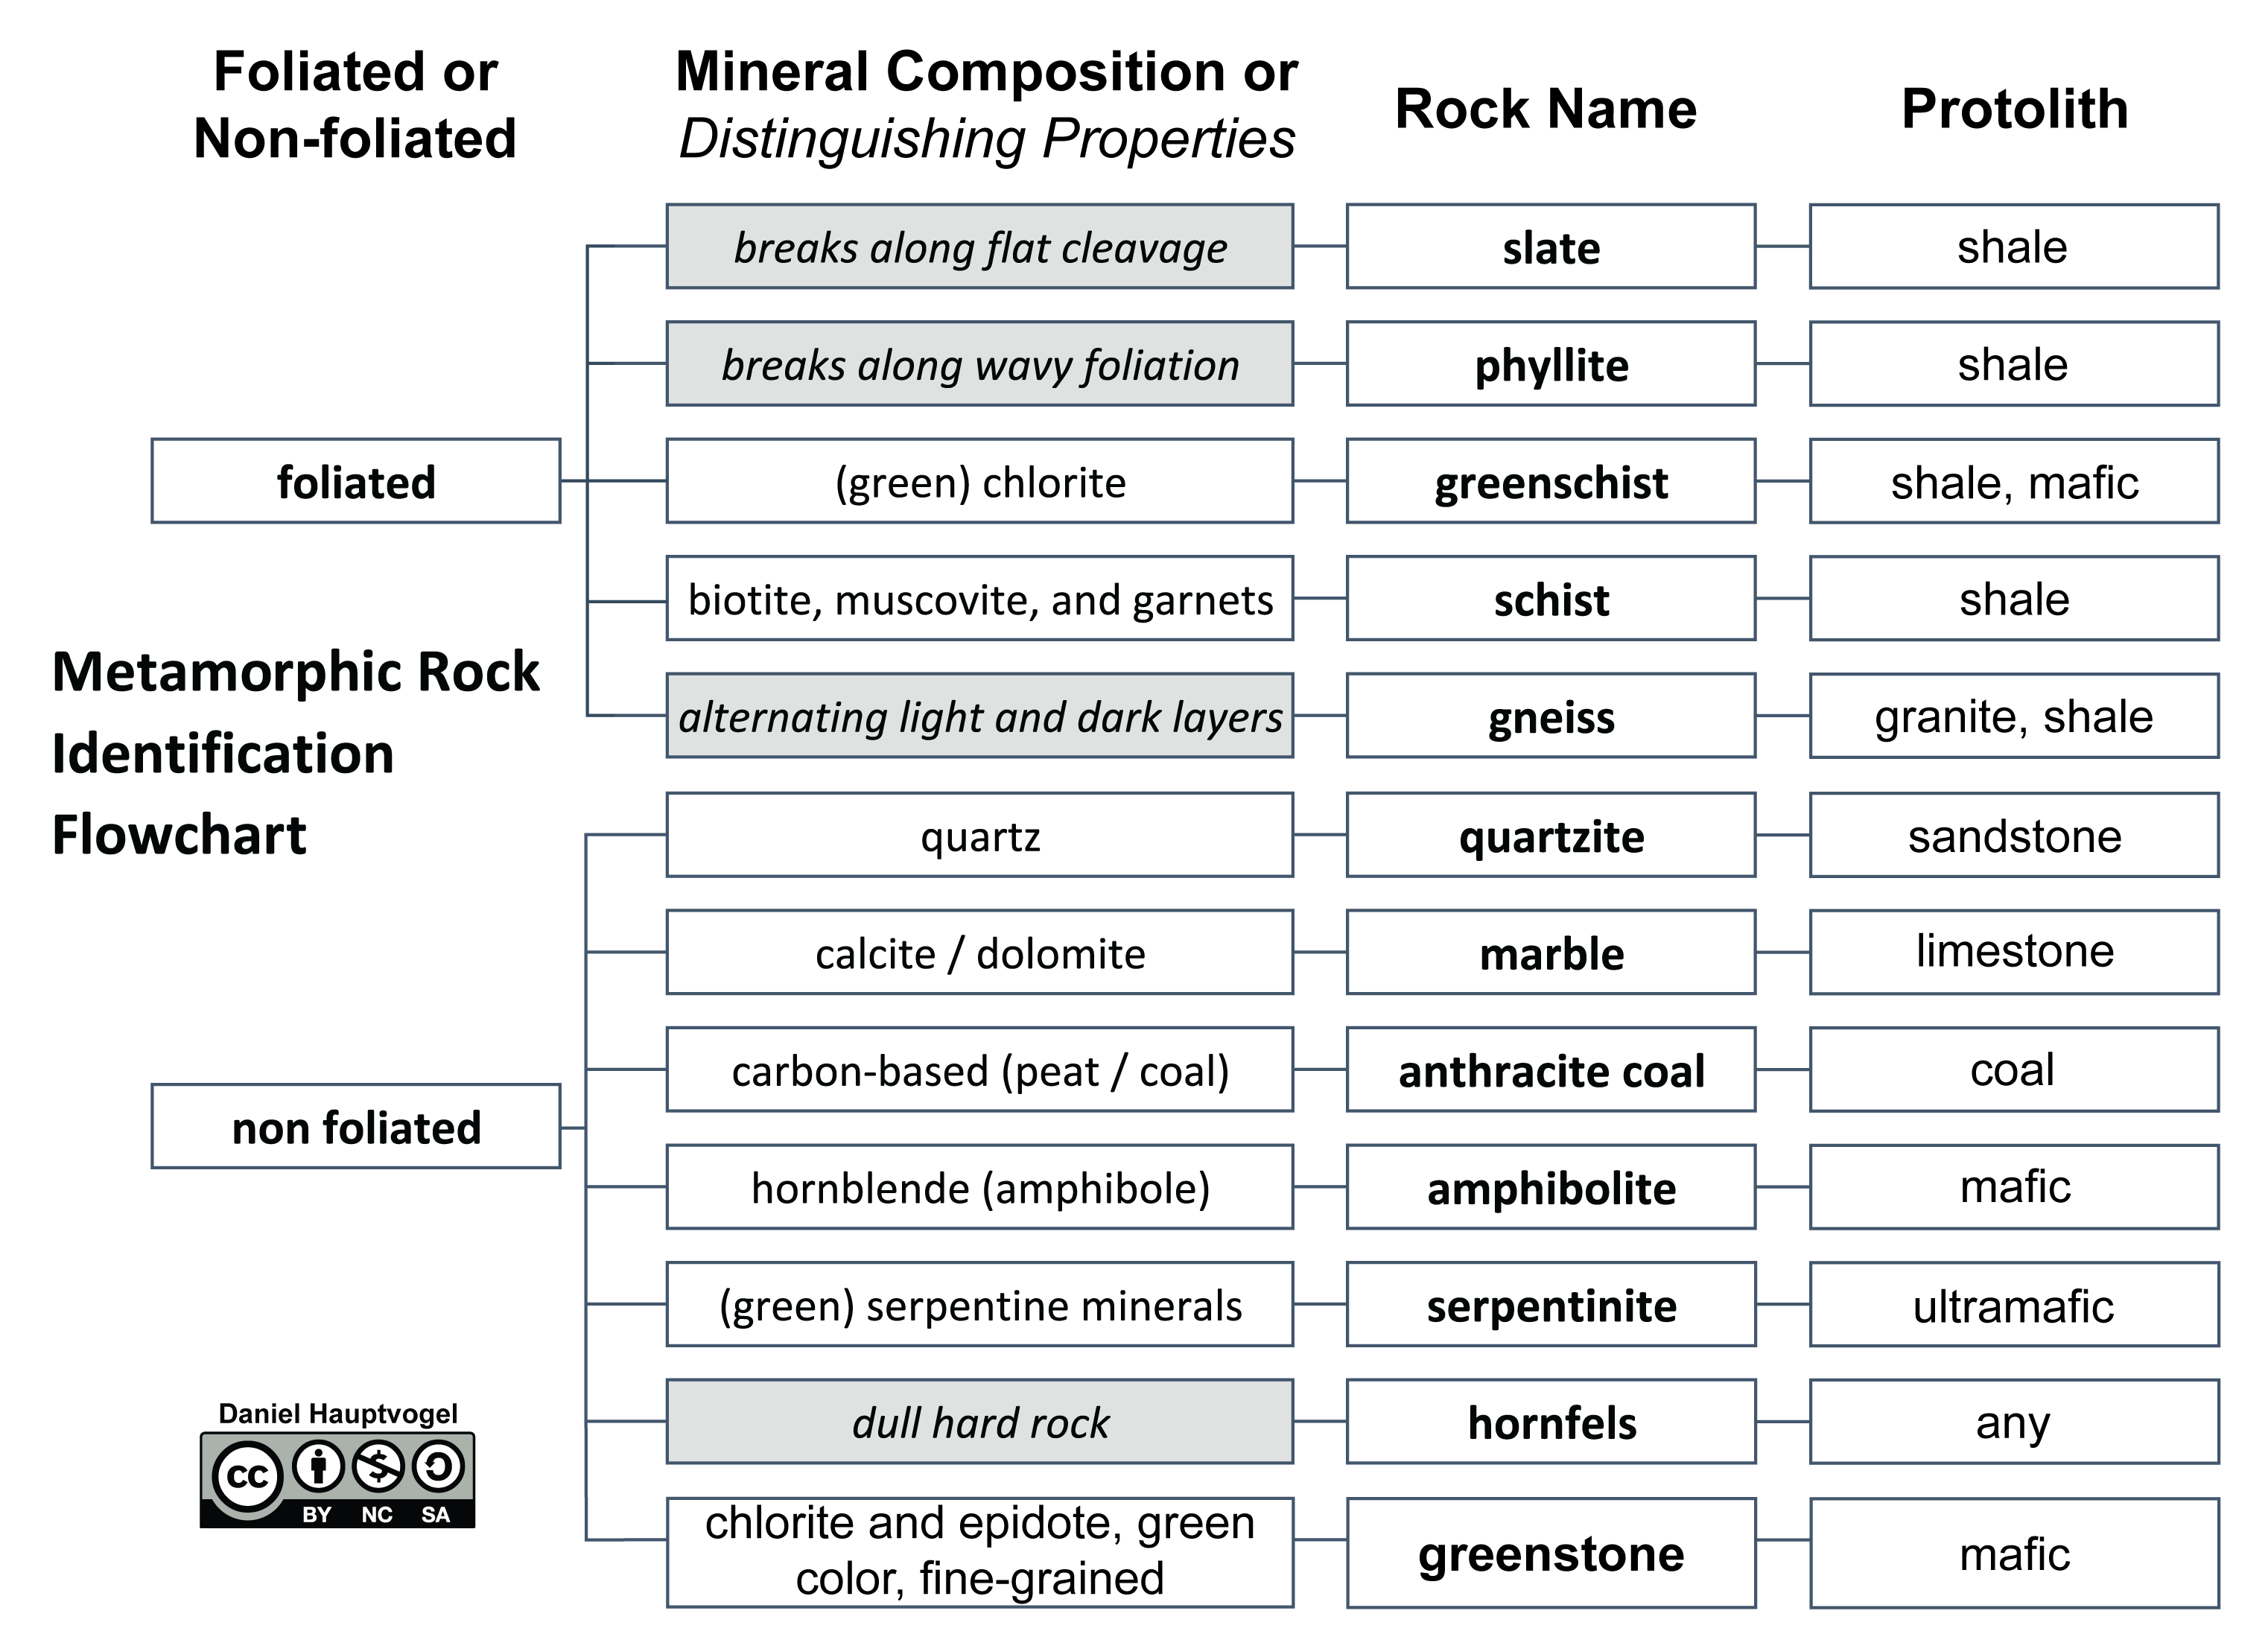
Your instructor has given you a selection of metamorphic rocks. Use Figure 8.1 and 8.2 to help you identify them and fill in Table 8.1. Unlike igneous and sedimentary rocks, you need to determine whether or not they are foliated as the first step. Then, identify the minerals and any other distinguishing properties. Protolith will be filled in during the next exercise.
| Sample | Foliated or Non-foliated | Minerals you can see | Rock Name | Grade (L, M, H) | Protolith |
|
|
|||||
|
|
|||||
|
|
|||||
|
|
|||||
|
|
|||||
|
|
|||||
|
|
|||||
|
|
|||||
|
|
8.3 Protoliths
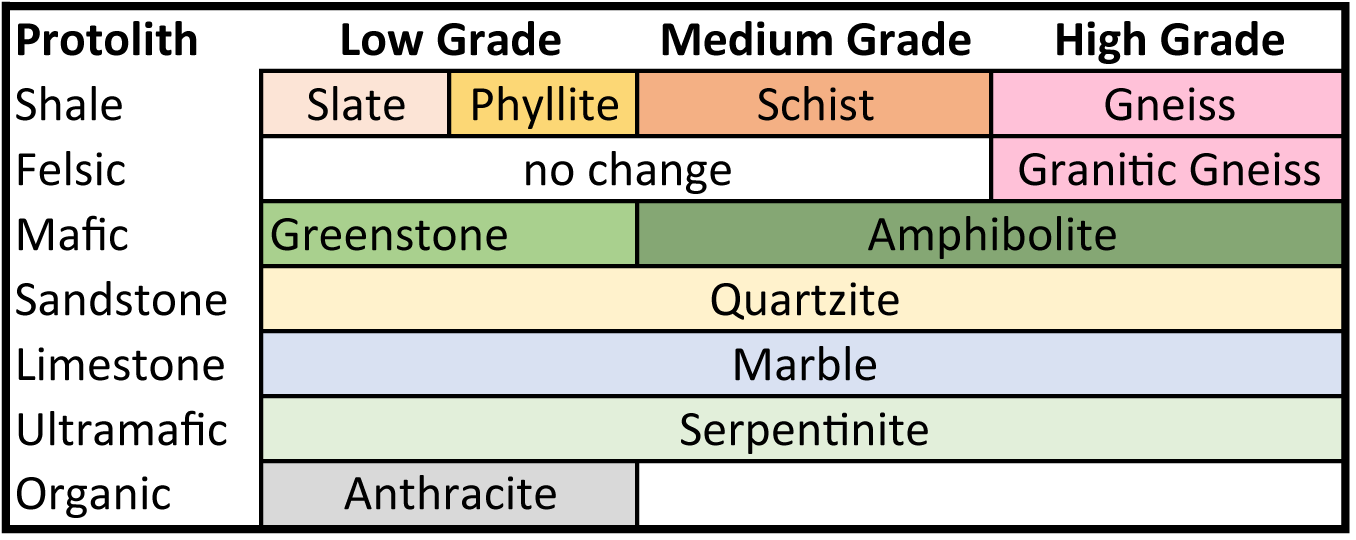
What a metamorphic rock was before metamorphism is called the protolith (Figure 8.3). In different tectonic settings, a variety of protolith types can be metamorphosed. These rocks will be exposed to the same range of pressure and temperatures conditions, however, the metamorphic rock that results will depend on the characteristics of the protolith.
Exercise 8.3 – Understanding Protoliths
Your instructor has given each of you a rock. Half of the class has metamorphic rocks, and the other half has protoliths.
- Which type of rock do you have and what’s its name? ____________________
- Now try to match up the metamorphic rocks with their protoliths. If you have a metamorphic rock, look for another student that has your protolith. If you have an igneous or sedimentary rock, find the rock that yours would turn into after metamorphism. Which rock did you pair up with and why?
- There is a blank column at the end of Table 8.1 for protolith. Go back and fill in the protoliths for your unknown metamorphic rocks in Table 8.1. Use Figure 8.3 to help.
8.4 Mapping Metamorphic Rocks
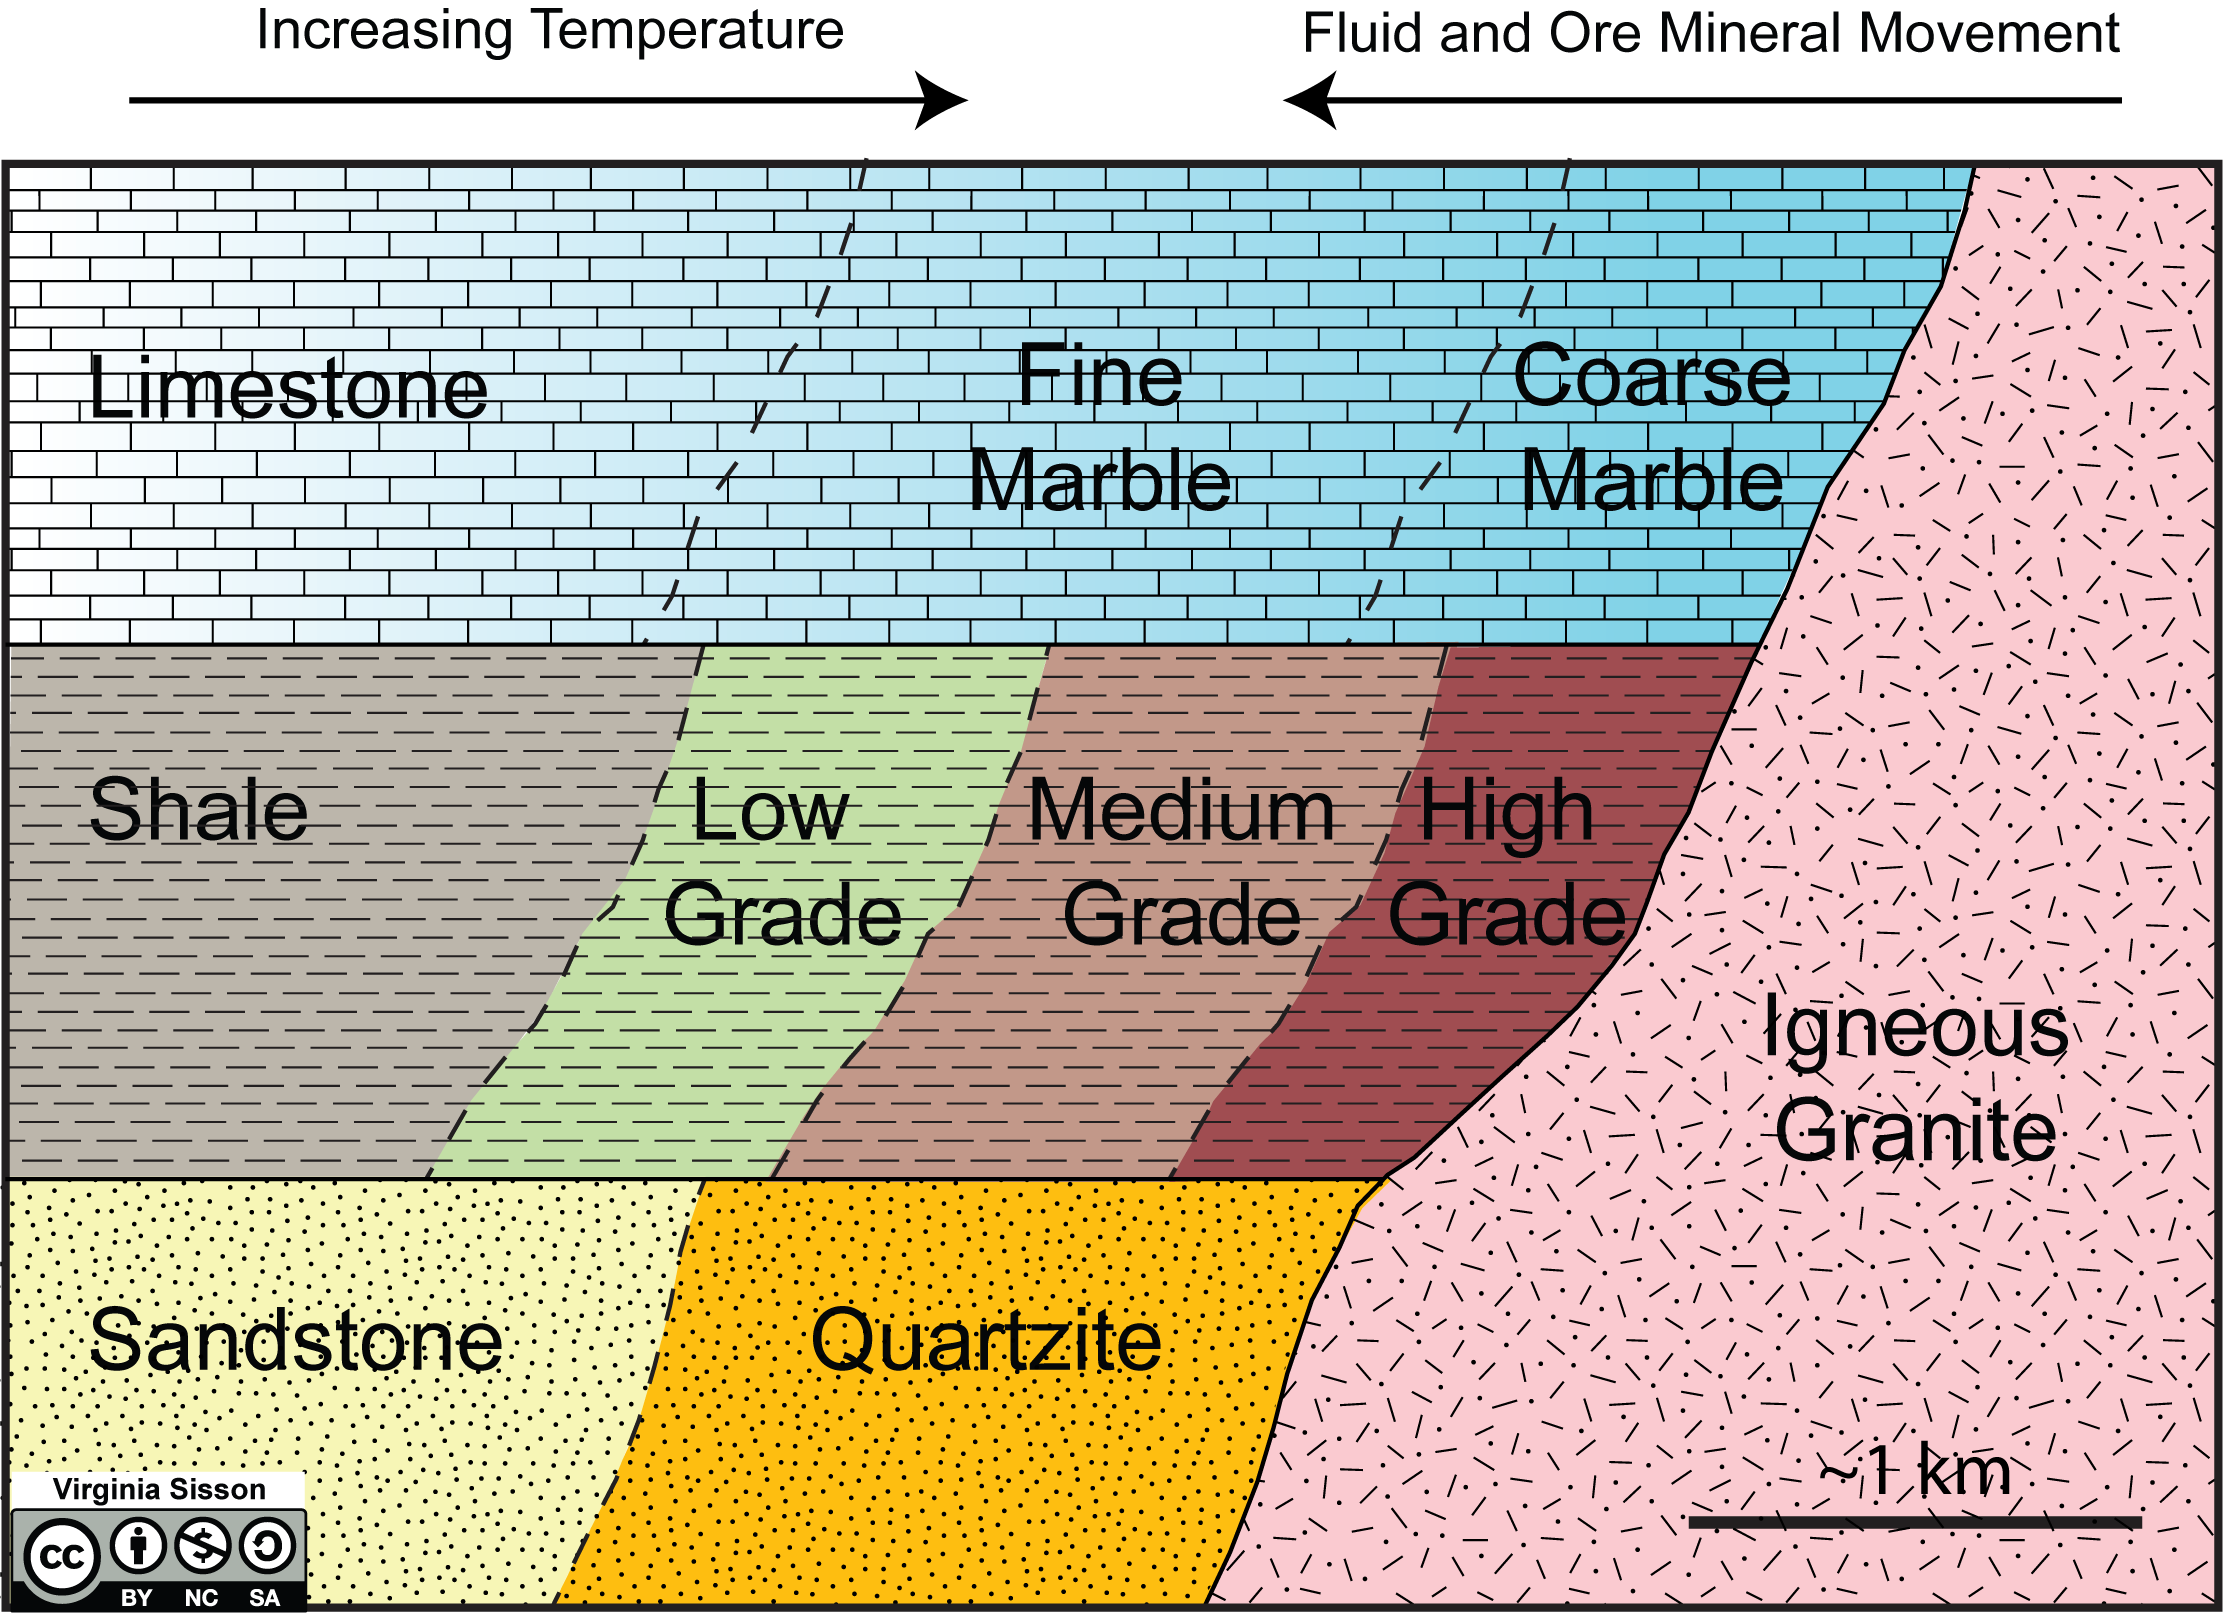
You’ve already learned that geologic maps can help you determine physical processes and geologic history of a region. The same is true for metamorphic maps as they help you figure out the direction of change of pressure and temperature in a region. They also help you determine the tectonic setting of the region. Figure 8.4 shows a metamorphic map for three different protoliths surrounding an igneous granite.
In addition to figuring the direction of temperature increase, this map also shows how fluids and chemical elements may have moved during metamorphism. In this case, silica may have moved from the granite into the marble. This also happens when copper, iron, tungsten, and other elements are deposited in economic ore deposits around igneous rocks.
Exercise 8.4 – Creating a Metamorphic Map
One of the geology professors has found out where all the samples you looked at for this lab are found. She has mapped their locations and indicated them with a dot on the map provided by your instructor. Each location is marked with the number for the rock type found there.
To help understand this map, you need to distinguish two types of data: metamorphic grade or how hot the rock was at the peak of metamorphism, and the composition of the rock (called protolith). So, to interpret the metamorphic rock data, you will need to draw lines and color/shade different regions to interpret the geology.
Using a dashed line, draw isograds (lines of equal metamorphic grade) between low to medium and medium to high grade. You should end up with two parallel lines, but these can be at an angle to the edge of the map. This is because heat travels consistently in one direction through the Earth; so isograds are parallel lines with grade decreasing away from the heat source. Not all metamorphic rocks are useful for determining metamorphic grade, as the texture in granoblastic rocks does not change with temperature (see Figure 8.3). Also, rocks that only have one or two minerals, such as marble and quartzite, do not have any index minerals.
Drawing isograds or lines of equal metamorphic grade:
- Draw each line as a continuous curve between or around points. Do not use short lines or lines drawn with a ruler.
- Draw lines between all points of equal value.
- Extend your lines all the way to the edge of the box.
- Completely erase any mistakes or stray lines.
Next, draw solid lines between and around different rock compositions/protoliths. The different compositions you have looked at include organic, calcareous, shales, felsic (sandstone/granite), and mafic rocks. For simplicity, you can group the organic with the shales as organic matter is often deposited with shales in marshes.
Shading the composition (rock type or protoliths)
- Use colored pencils to shade the different rock protoliths.
- Include the colors in the legend/key on the side or bottom of the map.
- Press lightly with your colored pencil using the side of the pencil and not the tip.
- Hold the pencil toward the back/end of the pencil, far away from the tip.
- Apply pressure evenly the entire time you are shading the rock protolith.
- Move the pencil back and forth in the same direction across the entire page (do not shade up-down in one section and left-right in another section.
- Completely shade the entire area – leave no area uncolored.
Next, lightly shade the area for each composition. A suggested color scheme is green = mafic, blue = calcareous (limestone), and yellow = felsic/shale/organic. The boundaries between the protoliths can be as small bodies shown as elongated lenses (not circles) or extend across the entire map.
After you have completed your map, answer these questions.
- Is this regional or contact metamorphism? Hint: look at the rock fabric and the scale of the map.
- Now that you have determined if this is regional or contact metamorphism, what do you think was the tectonic setting? Explain.
- Often, geologists want to know the geothermal gradient in a region. Use Figure 8.2 in to determine the temperature for each grade. What is the temperature range for this region? ____________________
- Next, divide the temperature range by the distance to get the horizontal geothermal gradient across your map. ____________________
8.5 Mineral Stability and Assemblages
Investigating metamorphic rocks is like being a detective to determine how deep and how hot rocks have been. Geoscientists call this geothermobarometry. One of the tools used to determine these variables are petrogenitic grids (Figure 8.5). These are x-y plots for the stability ranges of metamorphic minerals and mineral assemblages. The first petrogenitic grids were constructed by Bowen in the 1940 using experimentally determined mineral stability ranges that are plotted as metamorphic reaction boundaries to produce a petrogenetic grid for a particular rock composition. The regions of overlap of the stability fields of minerals form equilibrium mineral assemblages used to determine the pressure–temperature conditions of metamorphism.
Exercise 8.5 – Pressure and Temperature in Metamorphism
Geologists like numbers. For metamorphic rocks, the two most important numbers are the temperature that it formed at as well as the pressure. These are related by metamorphic reactions (lines on Figure 8.5). There are several types of metamorphic reactions. Some involve dehydration (loss of OH– ions), others are solid-state reactions such as polymorphic transitions, and others involve hydration (addition of OH– ions). On Figure 8.5, there are many metamorphic reactions shown by lines across the pressure-temperature grid. These are generally written with the reactants on the left side and the products on the right side. This is true for all reactions that are relatively vertical on this diagram.

| Abbreviation | Mineral | Chemical Formula |
| Ky | Kyanite | Al2SiO5 |
| And | Andalusite | Al2SiO5 |
| Sil | Sillimanite | Al2SiO5 |
| Prl | Pyrophyllite | Al2Si4O10(OH)2 |
| Ms | Muscovite | KAl2(AlSi3)O10(OH)2 |
| Bt | Biotite | KFe3(AlSi3)O10(OH)2 |
| Grt | Garnet | Fe3Al2Si3O12 |
| Chl | Chlorite | Fe5Al(AlSi3)O10(OH)8 |
| Cld | Chloritoid | FeAl2SiO5(OH)2 |
| St | Staurolite | Fe2Al9Si4O23(OH) |
| Qz | Quartz | SiO2 |
| Kfs | K-feldspar | KAlSi3O8 |
- Identify one reaction that involves dehydration (loss of OH). ____________________
- Write out the full chemical formula for this reaction. ___________________
- How much water (OH) was released during the reaction? ____________________
- Is the slope of this line steep or shallow? ____________________
- Identify one solid state (polymorphic) reaction (chemical formula remains the same). ____________________
- Is the slope of this line steep or shallow? ____________________
- What can you conclude about what happens to water (OH) during metamorphism?
- Low grade shales contain a dark green mica, chlorite. Those with a brownish color contain biotite. On Figure 8.5, color the area where rocks would contain chlorite and lack biotite. This would be the pressure-temperature conditions for slate.
- In a different color, color the area where rocks contain biotite but not garnet. This would be a phyllite.
- In a third color, color the area where rocks contain garnet and muscovite. This would the pressure and temperatures for a schist.
- Give the range of temperature and pressure conditions for slate, phyllite, and schist.
- Slate: ___________________
- Phyllite: ____________________
- Schist: ____________________
- To better constrain the pressure that these rocks formed at, you need some other mineral species in your samples. In most regionally metamorphic terrains, this is kyanite. If the rocks you are investigating have kyanite, at what pressure did they form? Explain.
- In the Central Texas region, especially near Inks Lake State Park, you can find sillimanite and muscovite in schist and gneissic rocks with no K-feldspar. What is the range of pressure that these rocks could occur at? ____________________
- Critical Thinking: In some regions, there are changes in the alumino-silicates (Ky, Sil, and And) with metamorphic grade. We can use these to find changes in pressure. So, if your phyllite has andalusite and your schist has kyanite, what probably happened to the pressure during metamorphism. What type of tectonic setting would this probably be?
Additional Information
Exercise Contributions
Virginia Sisson and Daniel Hauptvogel
References
Bowen, Norman (1940) Progressive Metamorphism of Siliceous Limestone and Dolomite. The Journal of Geology. 48: 225–274. doi:10.1086/624885
Spear FS, Cheney JT (1989) A petrogenetic grid for pelitic schists in the system SiO2-Al2O3-FeO-MgO-K2O-H2O. Contributions to Mineralogy and Petrology 101: 149-164. https://doi.org/10.1007/BF00375302
a mineral that forms under specific pressure and temperature conditions, and provides information about the rock's metamorphic history. Examples include kyanite, garnet, etc.
a rock that existed before it gets metamorphosed, also called parent rock
the increase in temperature with depth in the Earth
the science of measuring the pressure and temperature history of a metamorphic or intrusive igneous rocks. This term is a combination of geobarometry, where a pressure of mineral formation is resolved, and geothermometry where a temperature of formation is resolved.
a geological phase diagram that connects the stability ranges of metamorphic minerals or mineral assemblages using metamorphic reactions
a metamorphic rock with a shale protolith
