
Chapter 3: Plate Tectonics
Boundaries and Earth's Structure
Learning Objectives
The goals of this chapter are to:
- Identify types of plate boundaries and compare their characteristic earthquake and volcanic activities
- Assess the basic lines of evidence supporting plate tectonics
- Use Earth features to explore the drivers of plate tectonic motions
3.1 Introduction
Plate tectonics is the grand unifying theory in geology. It gets that title because many topics in geology can be explained, in some way, by the movement of tectonic plates. Tectonic plates are composed of Earth’s crust and the uppermost, rigid portion of the mantle. Together, they are called the lithosphere.
Exercise 3.1 – Discovering Plate Boundaries
A team from the world-renowned EAS research group (Earth and Atmospheric Sciences) has won a multimillion-dollar government contract to examine the latest information about the Earth and develop hypotheses about how our planet has evolved. You have been hired to analyze sets of observational data to determine if there is any link between them.
Break up into four groups. Each group has a specialty, and your instructor will give you one of the following maps:
- Seismology (earthquakes)
- Volcanology (volcanoes)
- Physiography (topography)
- Geochronology (age of rocks)
Examine the map in your specialty group and answer the following questions.
- What is your specialty? ____________________
- What do the colors and/or symbols on your map mean?
- Examine your map and describe at least three patterns you see in the distribution of your data (for example, there is a linear chain of volcanoes on the west coast of South America).
Now, get into four new groups. These new groups must have at least one member from each specialty. Each specialist should explain what their map shows and describe the three map patterns they identified.
- Compare all four maps and identify patterns or relationships between them. These can be between two, three, or all four of the maps. Make at least five observations.
Select one person from your group to inform the class on the patterns you identified amongst the maps.
- What similarities did the other groups find that were the same as yours?
- What similarities did other groups find that yours didn’t?
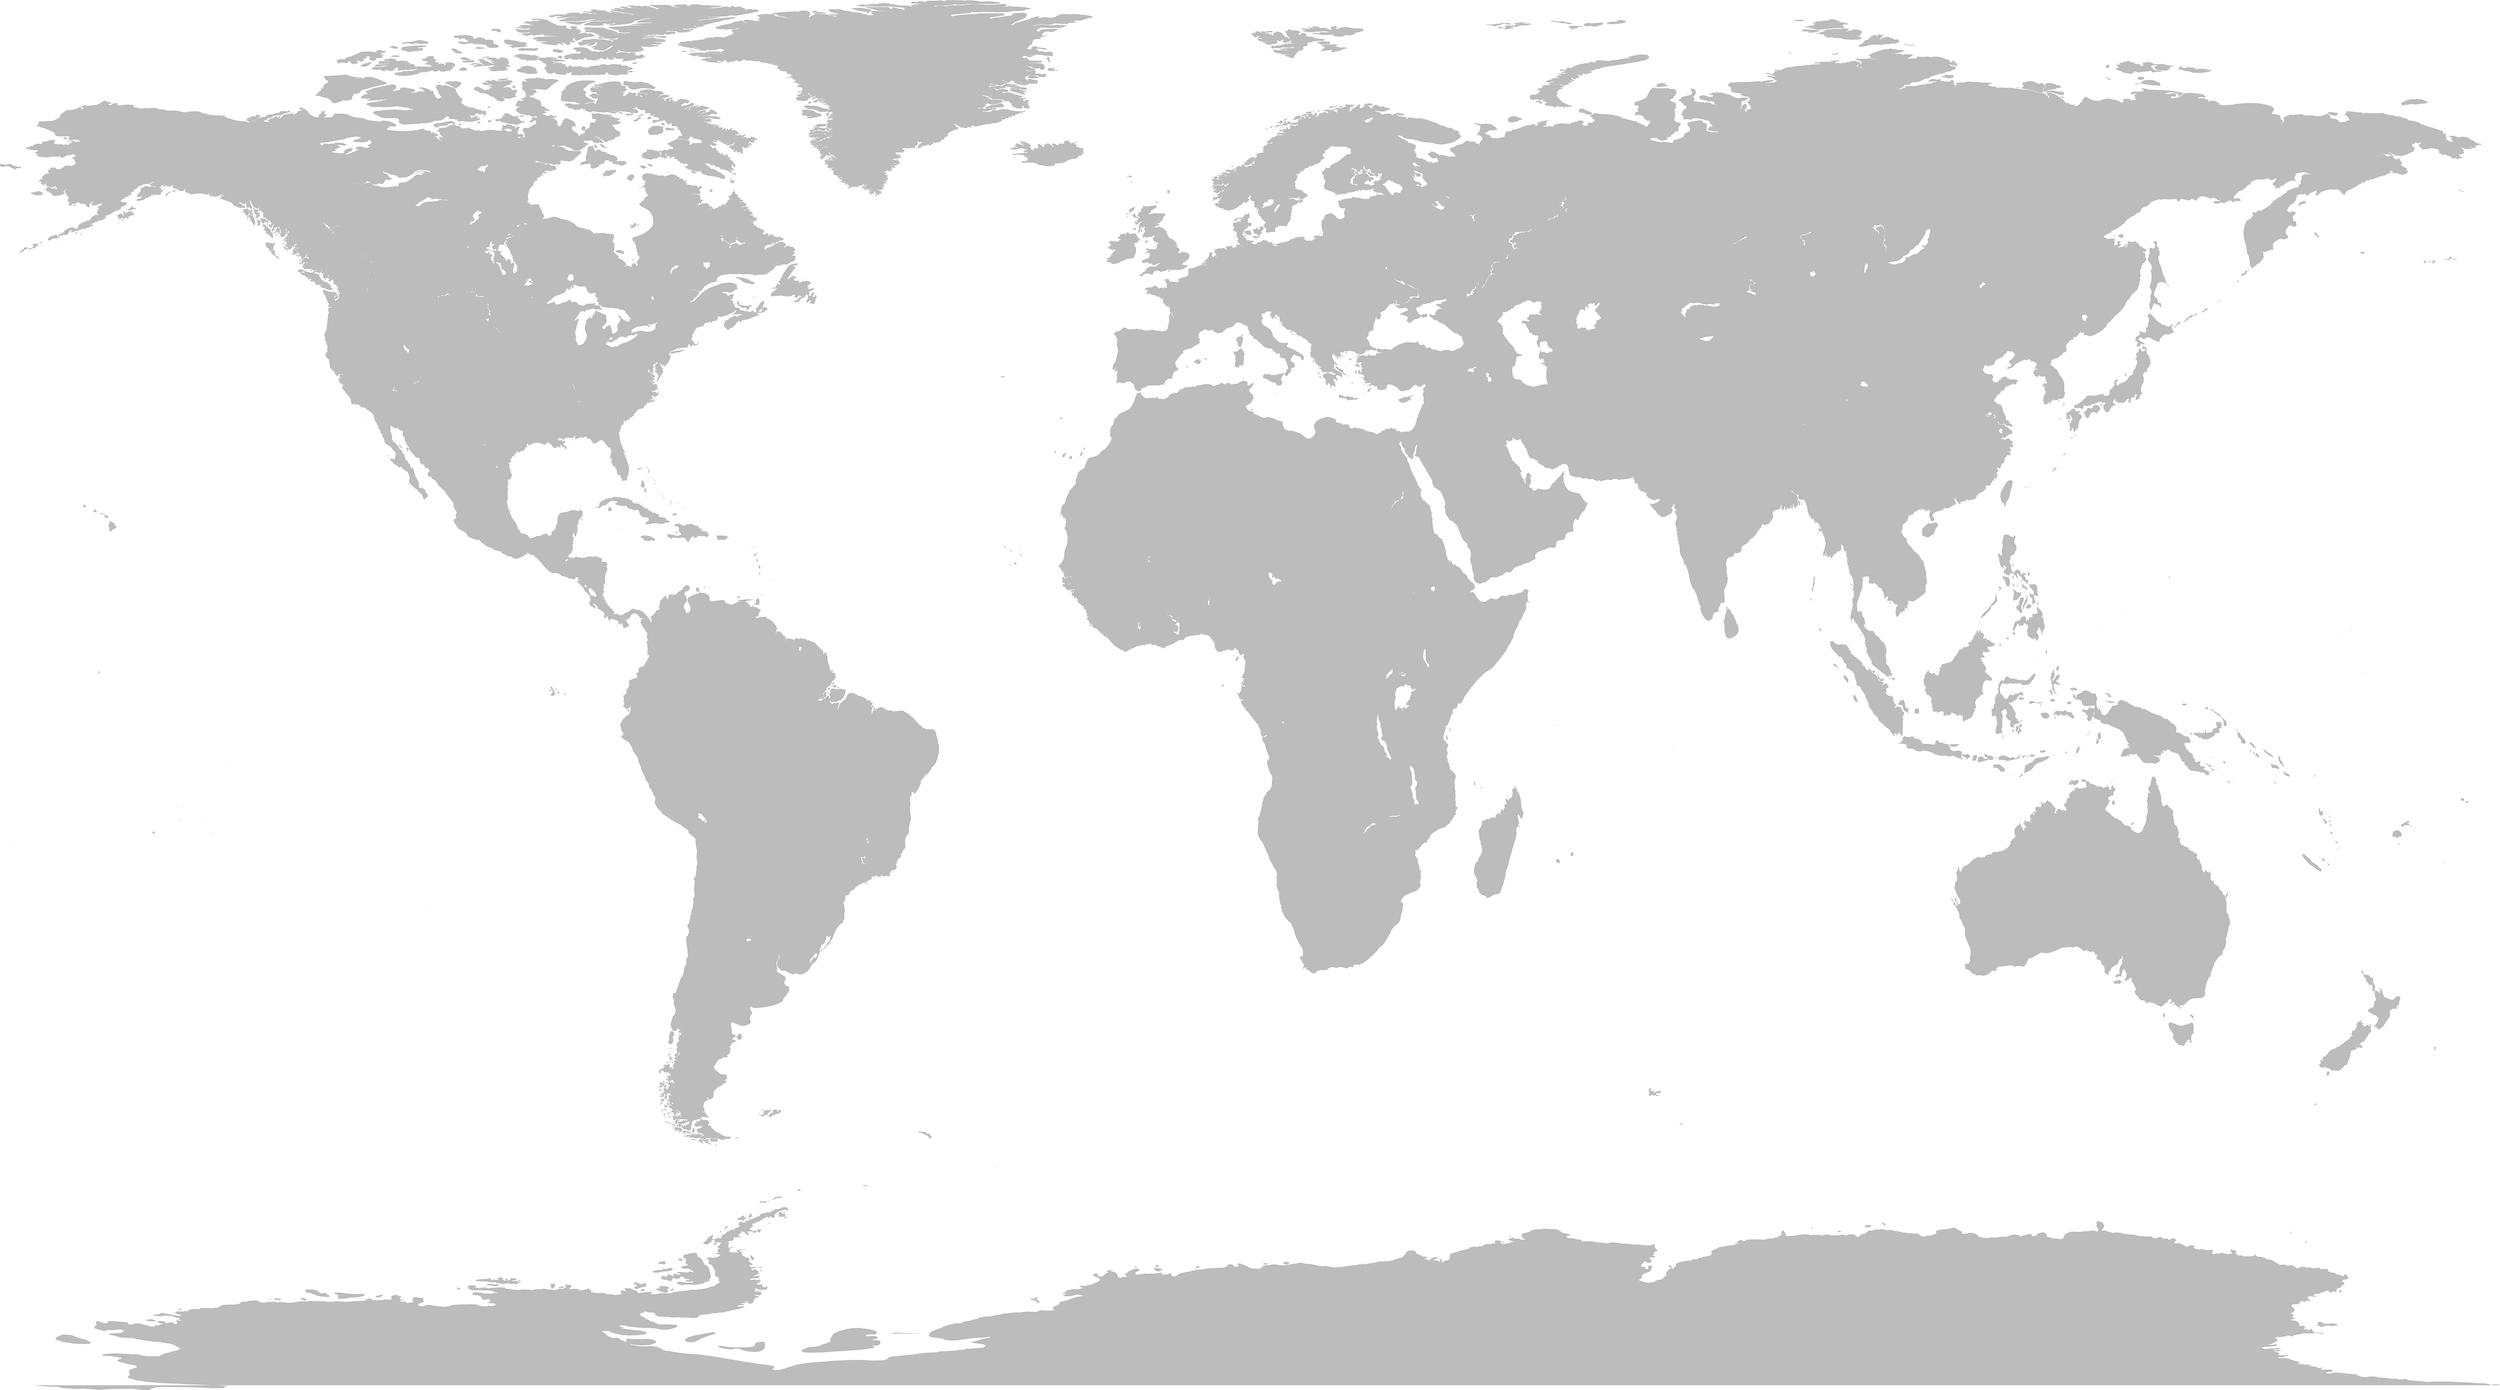
- It has been suggested that Earth’s surface features are broken into fragments called lithospheric plates that fit together like pieces of a jigsaw puzzle. From your observations and those of your EAS colleagues, draw lines on the world map in Figure 3.1 that might outline major plate boundaries.
This exercise is inspired by Dale Sawyer’s Discovering Plate Boundaries exercise.
3.2 Plates, Crust, and Lithosphere
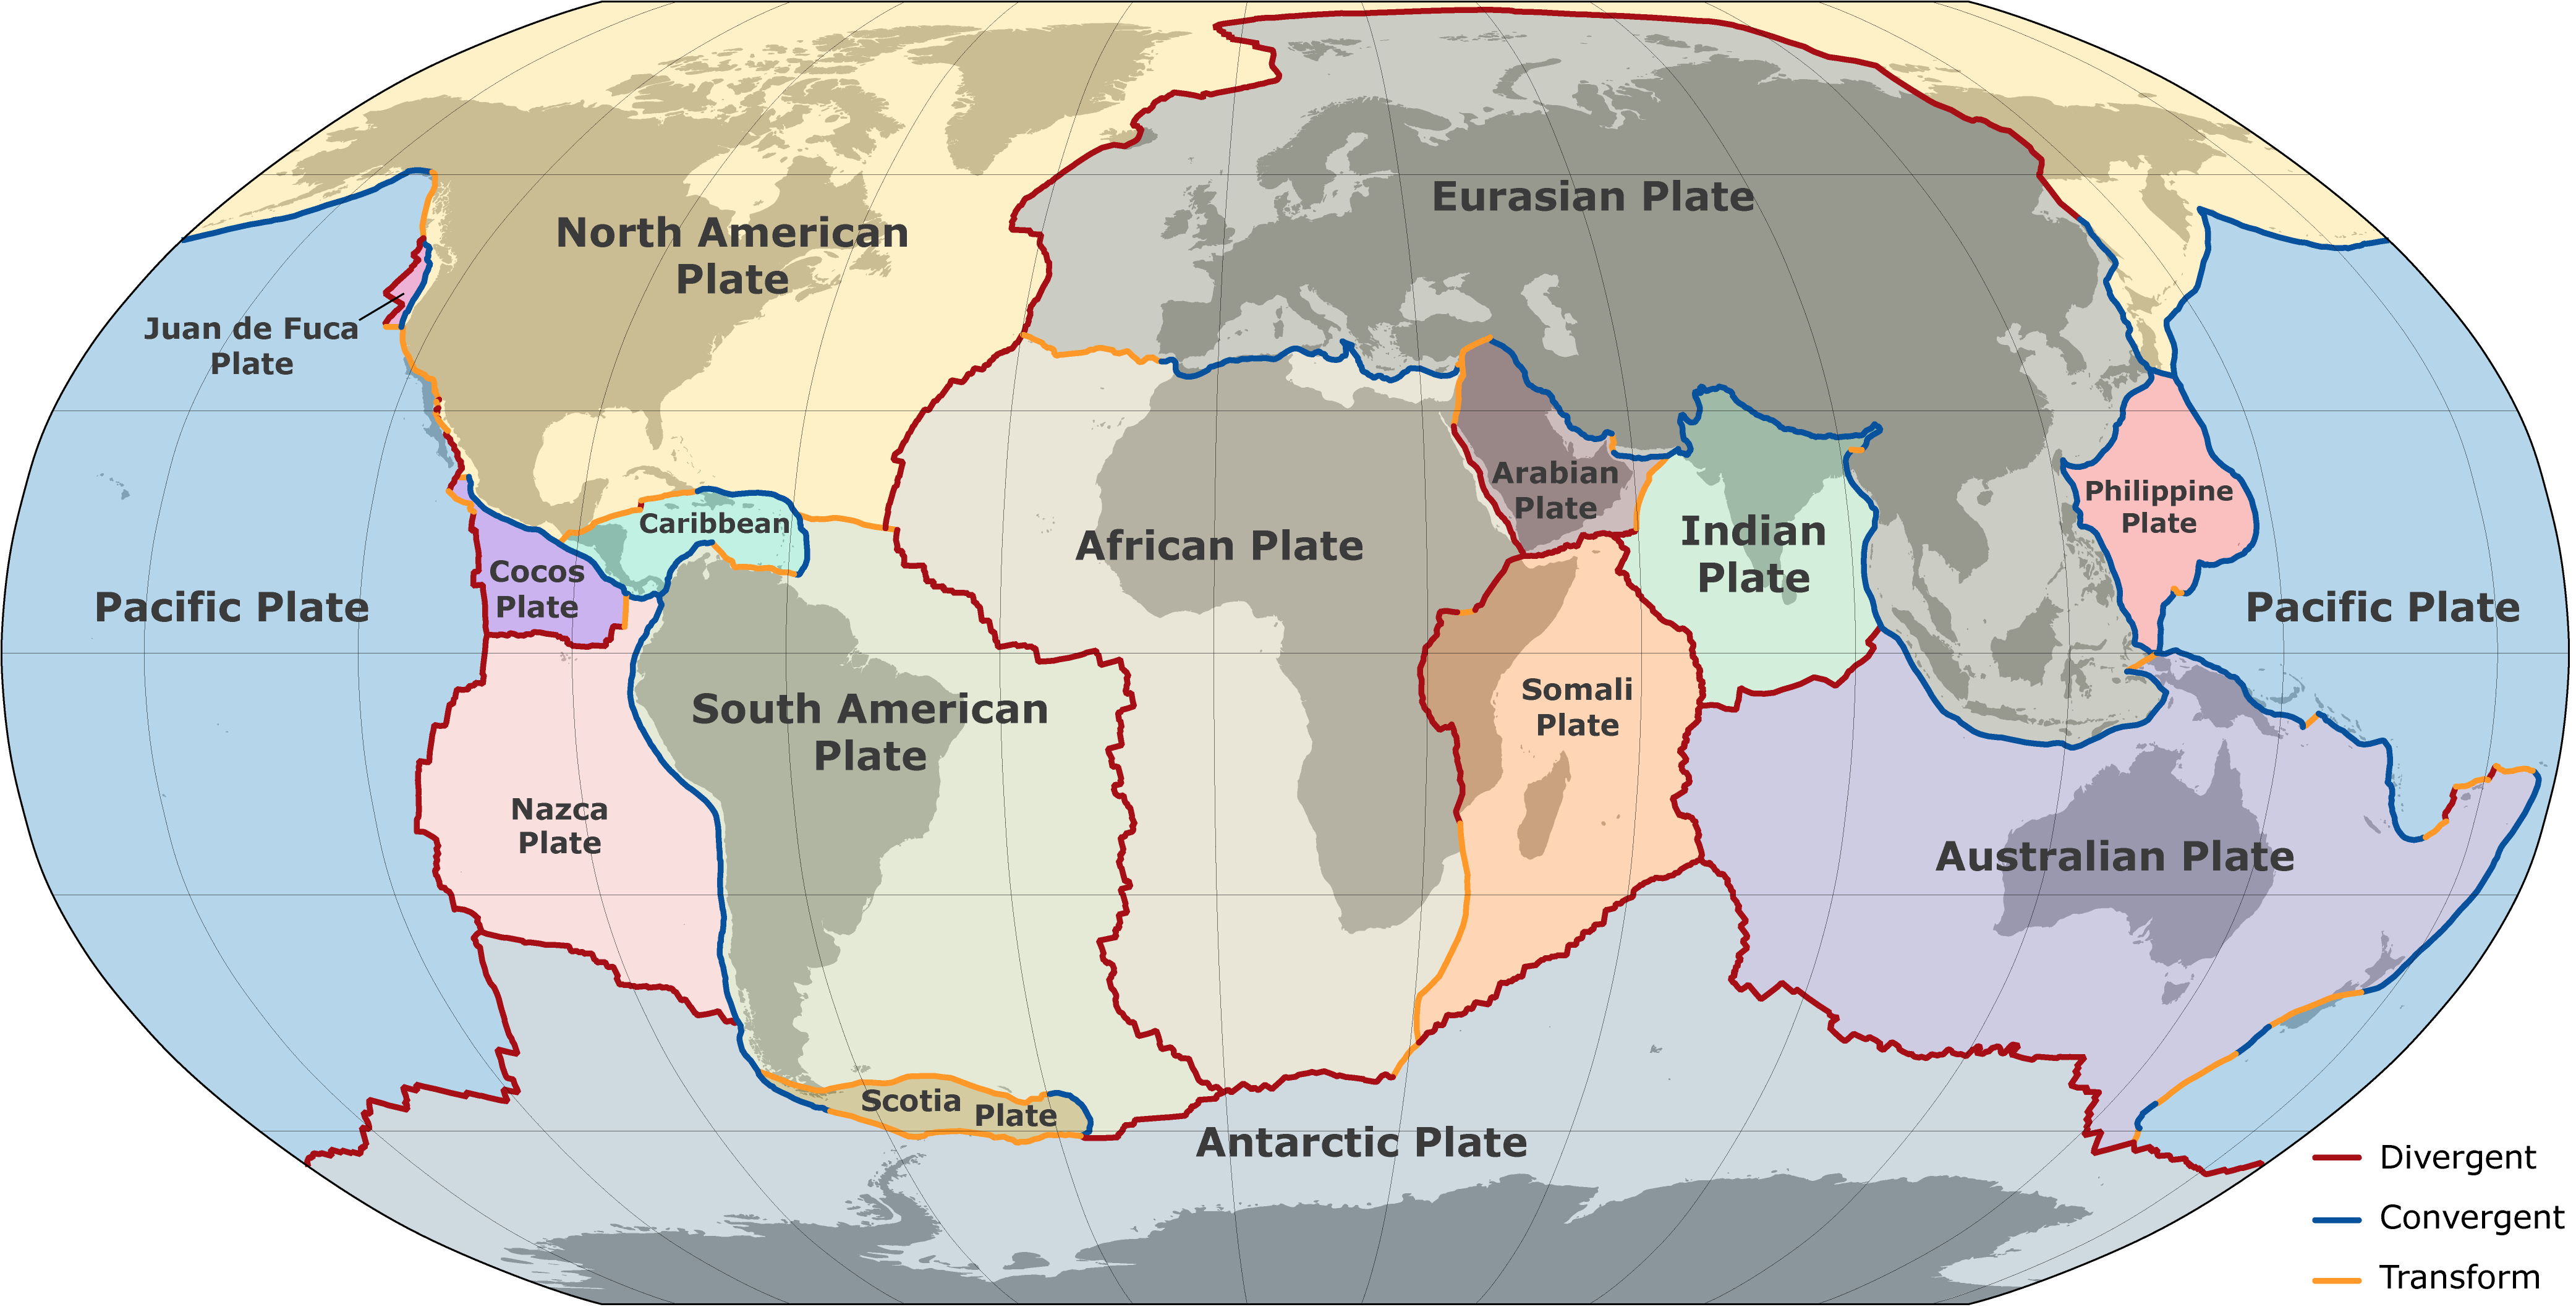
In Exercise 3.1, you discovered the Earth’s surface is broken into pieces called tectonic plates. You also began to see the relationship between earthquakes, volcanoes, topography, seafloor age, and plate tectonics. These plates move across the Earth’s surface, and the boundaries between plates vary depending on whether plates are moving apart (divergent), coming together (convergent), or moving alongside one another (transform). Along these plate boundaries is where you find most of the world’s earthquakes.
Geologists divide the Earth into either physical or compositional layers (Figure 3.2). The compositional layers include crust, mantle and core. Whereas the physical layers include the lithosphere, asthenosphere, outer core and inner core.
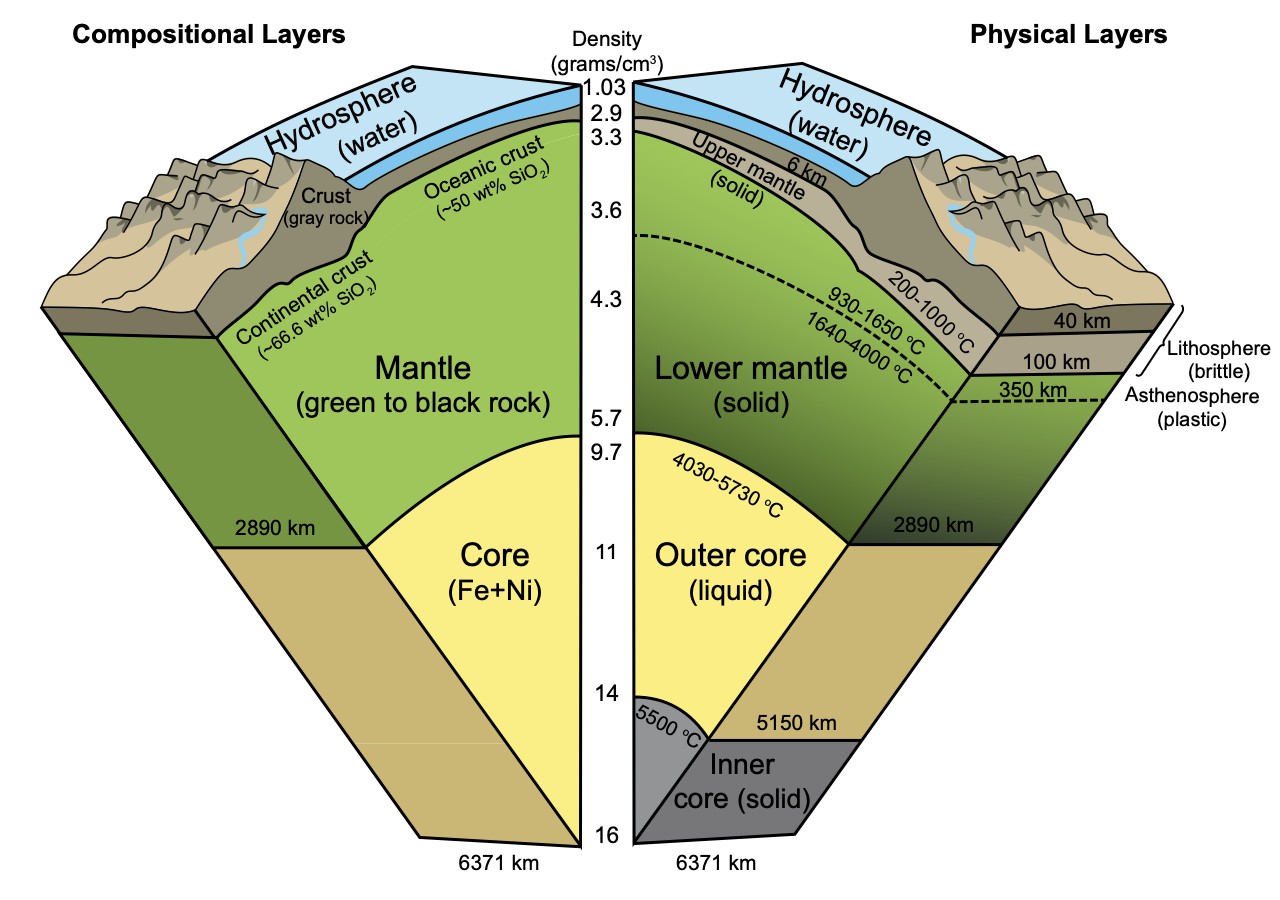
Tectonic plates are also called the lithosphere, which is Earth’s crust and the uppermost solid part of the mantle. The crustal portion has two different compositions, oceanic and continental (Table 3.1). The lithosphere sits on top of a weaker portion of the mantle, called the asthenosphere, which allows the lithosphere to move (i.e., plate tectonics)
| Property | Oceanic Crust | Continental Crust |
|---|---|---|
| Thickness | 5-10 km | 25-80 km |
| Density | 3.0g/cm3 | 2.7g/cm3 |
| Silica (SiO2) Content | 50% | 66.6% |
| Composition | Fe, Mg, and Ca silicates | K, Na, and Al silicates |
| Color | Dark | Light |
Exercise 3.2 – Exploring Plates and Plate Boundaries
Use Figures 3.2 and 3.3 to answer the following questions
- Provide a detailed description of what Figure 3.2 shows and what the colored lines mean.
- Which type of plate boundary is most abundant? ____________________
- On which plate does the mainland United States including Alaska reside? ____________________
- Where is the eastern edge of this plate? ____________________
- What type of lithosphere makes up this plate? ____________________
- Are there any other plates that have a similar makeup? If so, name them. ____________________
- Compare and contrast the plate tectonic settings of the Atlantic and Pacific Oceans. Look at the boundaries within the oceans and on their margins.
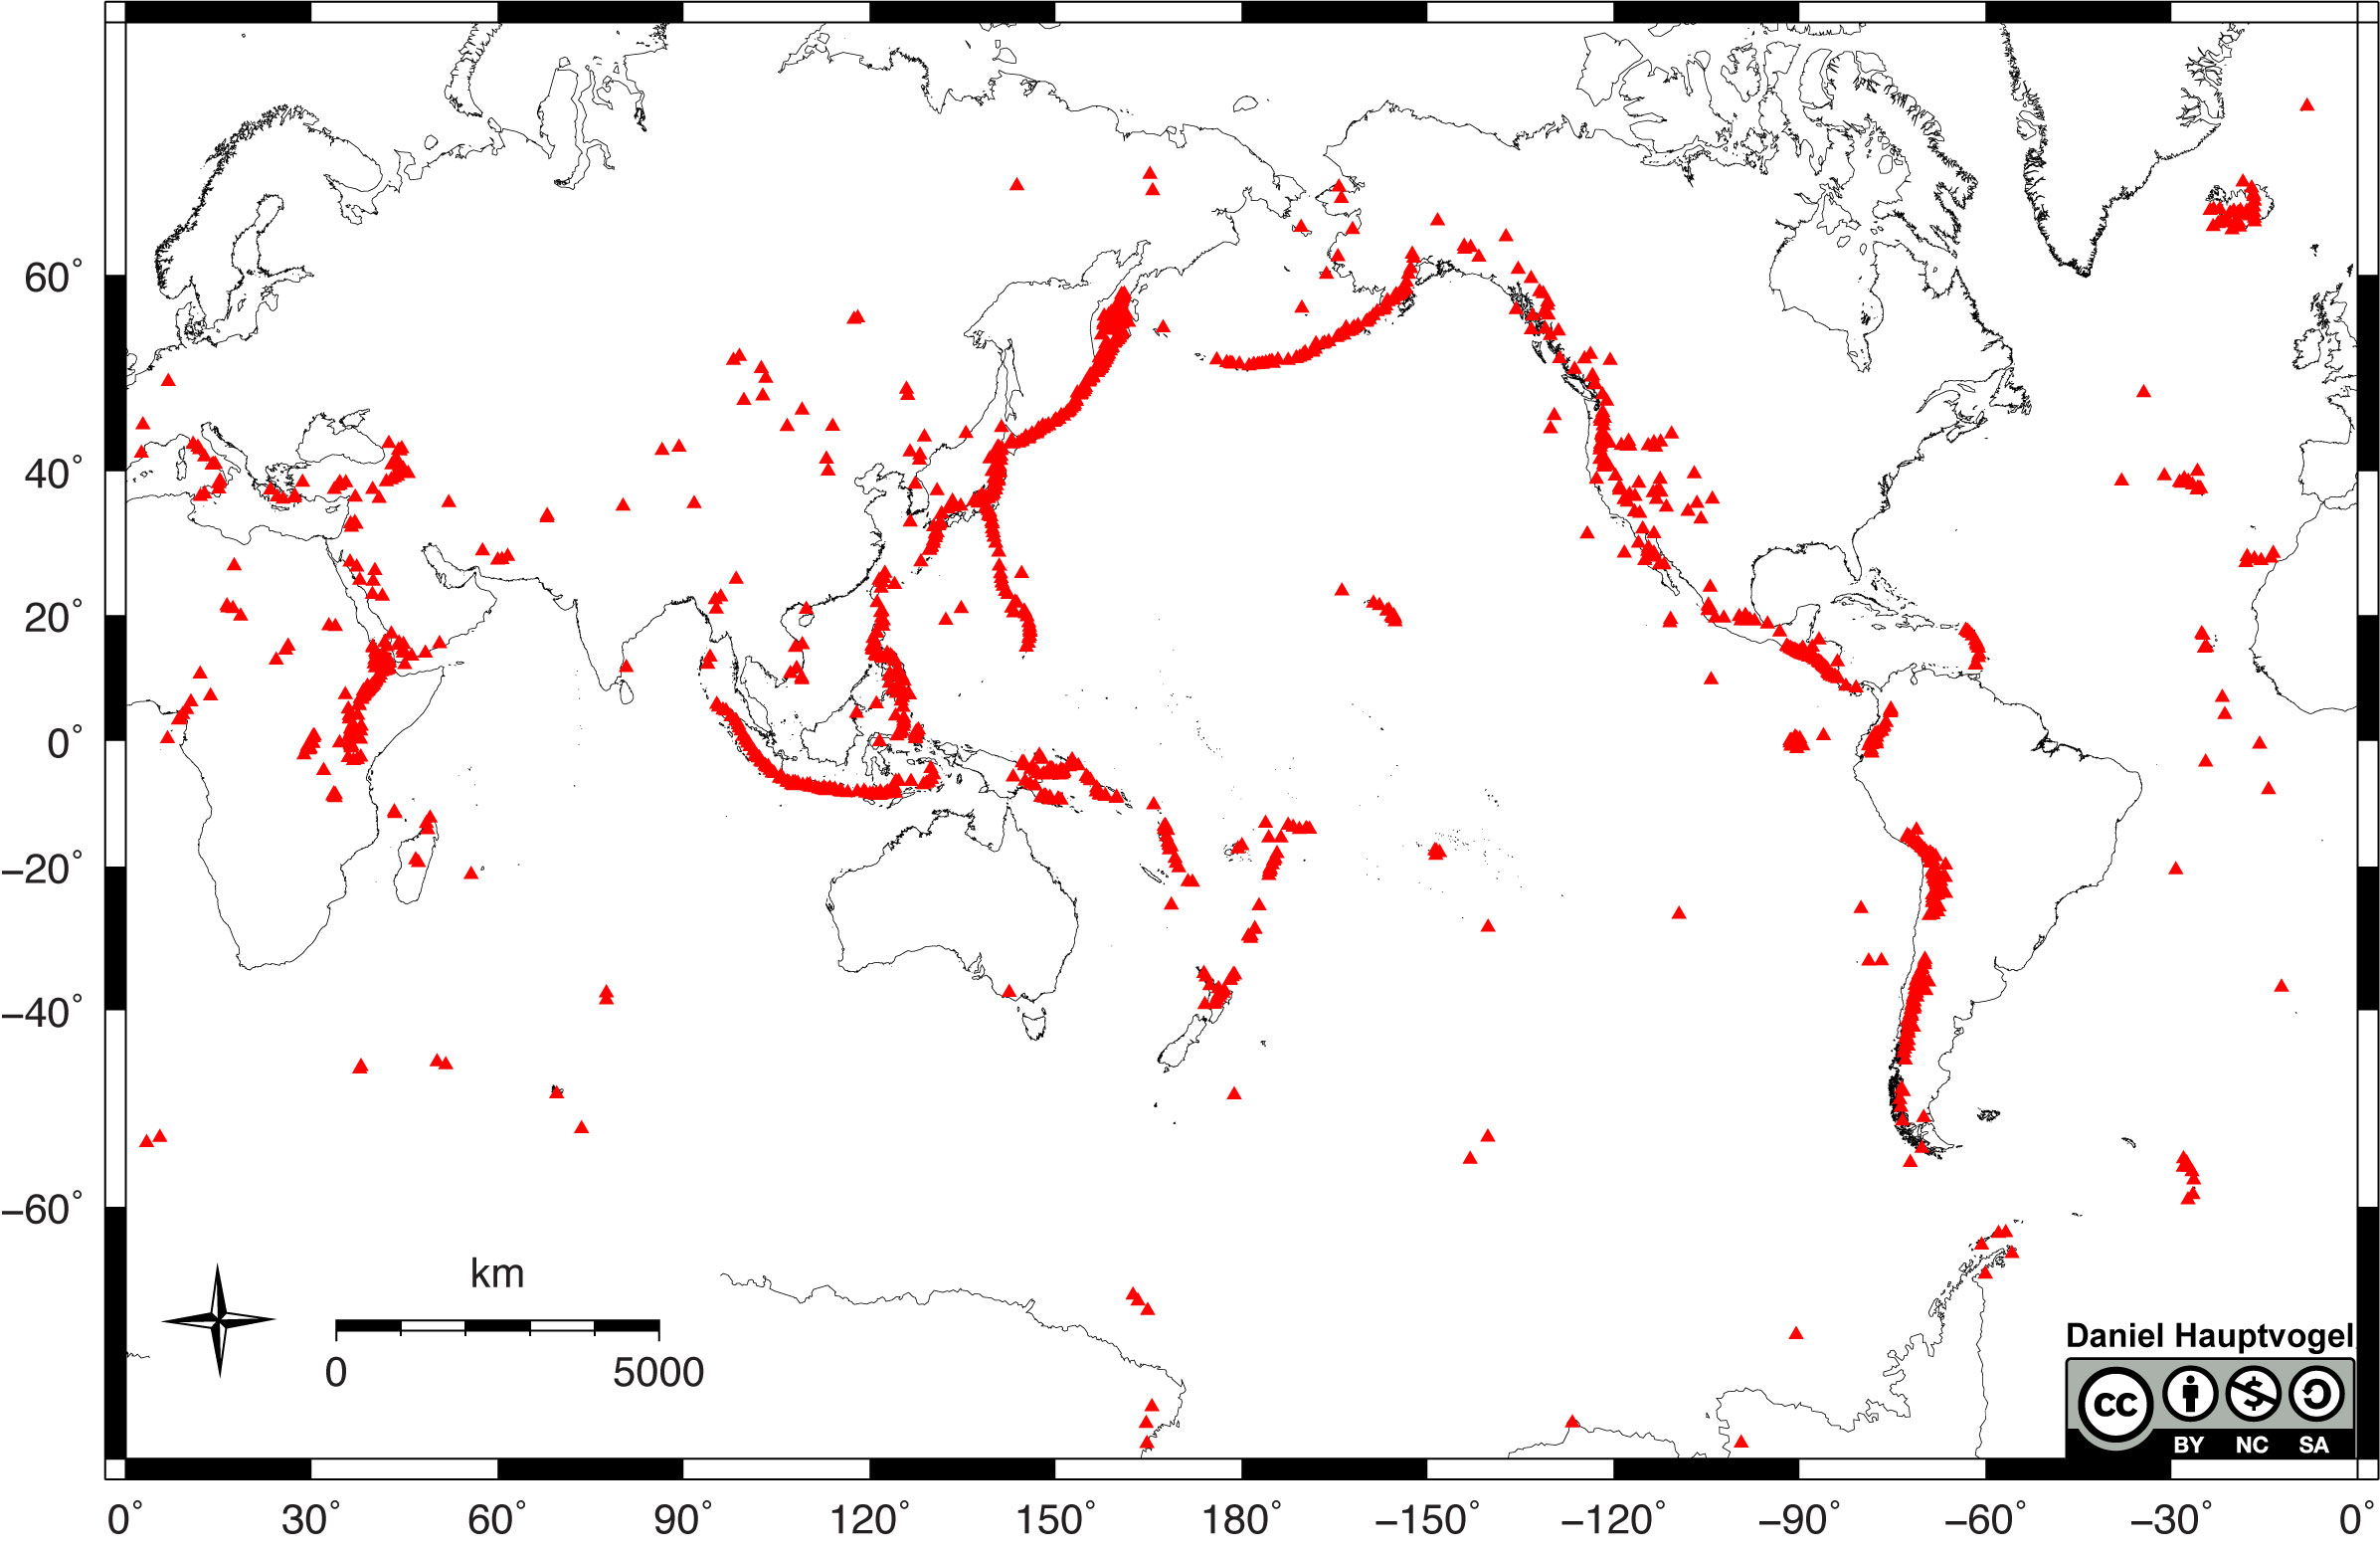
- Look at the map of volcanoes in Figure 3.3 and compare that to the types of plate boundaries in Figure 3.2. Come up with an explanation about the location of most volcanoes as they relate to plate tectonics.
- Critical Thinking: When comparing the Atlantic and Pacific Oceans, which one do you think is getting bigger and which is becoming smaller? Explain your answer.
3.3 Subduction Zones
When oceanic lithosphere is part of a convergent boundary, it will sink and descend into Earth’s mantle due to the difference in density, a process called subduction (Figure 3.4). This happens in collisions between two oceanic plates, oceanic-continental plates, and continent-continent collisions. In an oceanic-oceanic collision, the denser of the two oceanic plates, which is usually the older plate, will subduct.
It is a common misconception that the subducting plate will melt to create magma. The truth is that the downgoing plate is still too cold to melt, and it takes a very long time to heat up enough to begin melting. What really happens is as the subducting plate descends, water from the oceanic slab is driven off and enters the asthenosphere directly above it. This water lowers the melting point of the asthenosphere and causes part of it to begin melting. The newly created magma then rises toward the surface, where it can erupt and form volcanoes.
Yes, most volcanoes are associated with subduction zones.

Exercise 3.3 – Connecting Earthquakes and Volcanoes
In the first exercise of this chapter, you discovered the link between the locations of earthquakes, volcanoes, and plate boundaries. Now, let’s examine this in more detail. The two maps below show the tectonic settings for Central America and the Western Pacific Ocean; both are subduction zones (Figure 3.5).
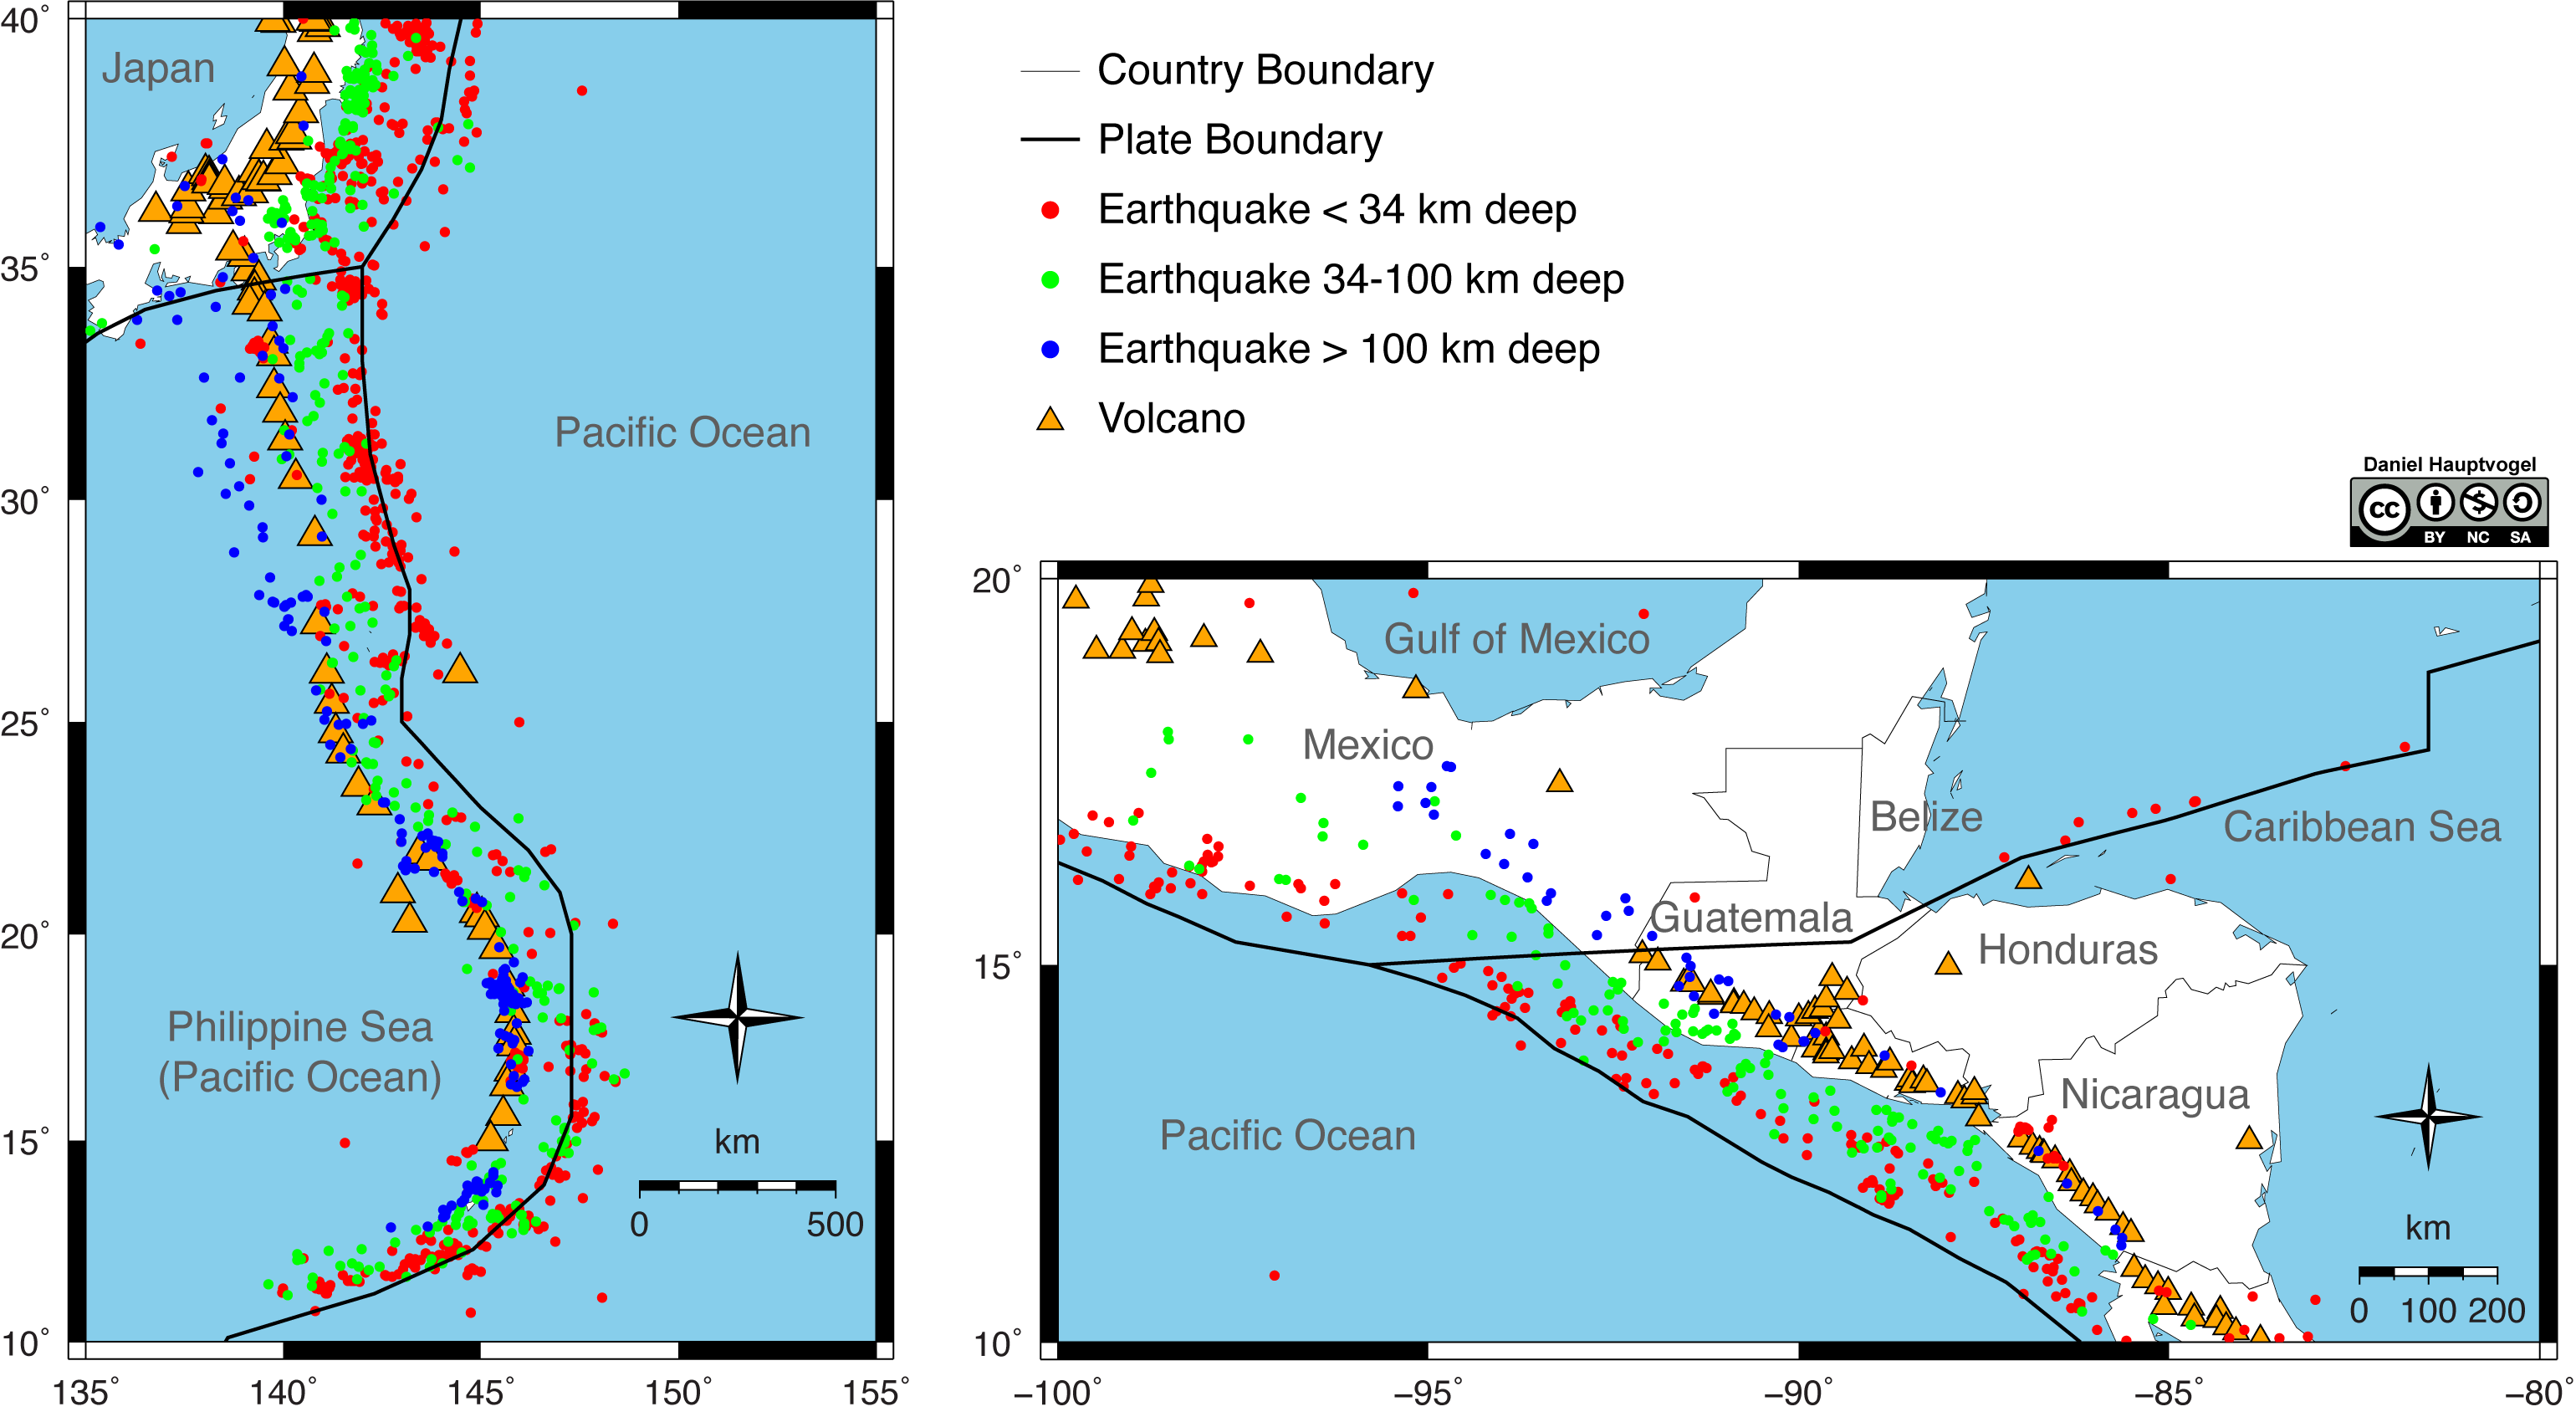
- Look at the maps and describe how the depth of earthquakes changes in a subduction zone. Why does this change occur?
- Why are earthquakes common on only one side of a subduction zone?
- Critical Thinking: What does this information tell you about where earthquakes are most common in subduction zones?
In Exercises 3.1 and 3.2, you may have discovered the link between the locations of volcanoes and plate boundaries. When you look closely, however, they are not an exact match. In most cases, the volcanoes are some distance from the plate boundary and only located on one side (similar to earthquakes).
- Can you find any pattern between the depth of earthquakes and the location of volcanoes? Explain.
- Volcanoes are fueled by magma that is produced within the Earth. At what depth do you think magma is produced at subduction zones? Explain.
- Based on this information, draw a cross-section of a subduction zone below. Be sure to include the plates involved, earthquake locations, and volcanoes.
| Sketch Area: |
3.4 Mid-Ocean Ridges, Seafloor Age, and Plate Motion
In WWII, geophysical techniques such as sonar were used to detect submarines and geoscientists realized that this could be used map the seafloor. This led indirectly to the discovery of mid-ocean ridges. Behind the scenes, Marie Tharp almost single handily mapped the sea floor and discovered the Mid-Atlantic ridge. During this same time, Mary Sears headed the Hydrographic Office and mapped sea currents to help predict when naval assaults should occur.
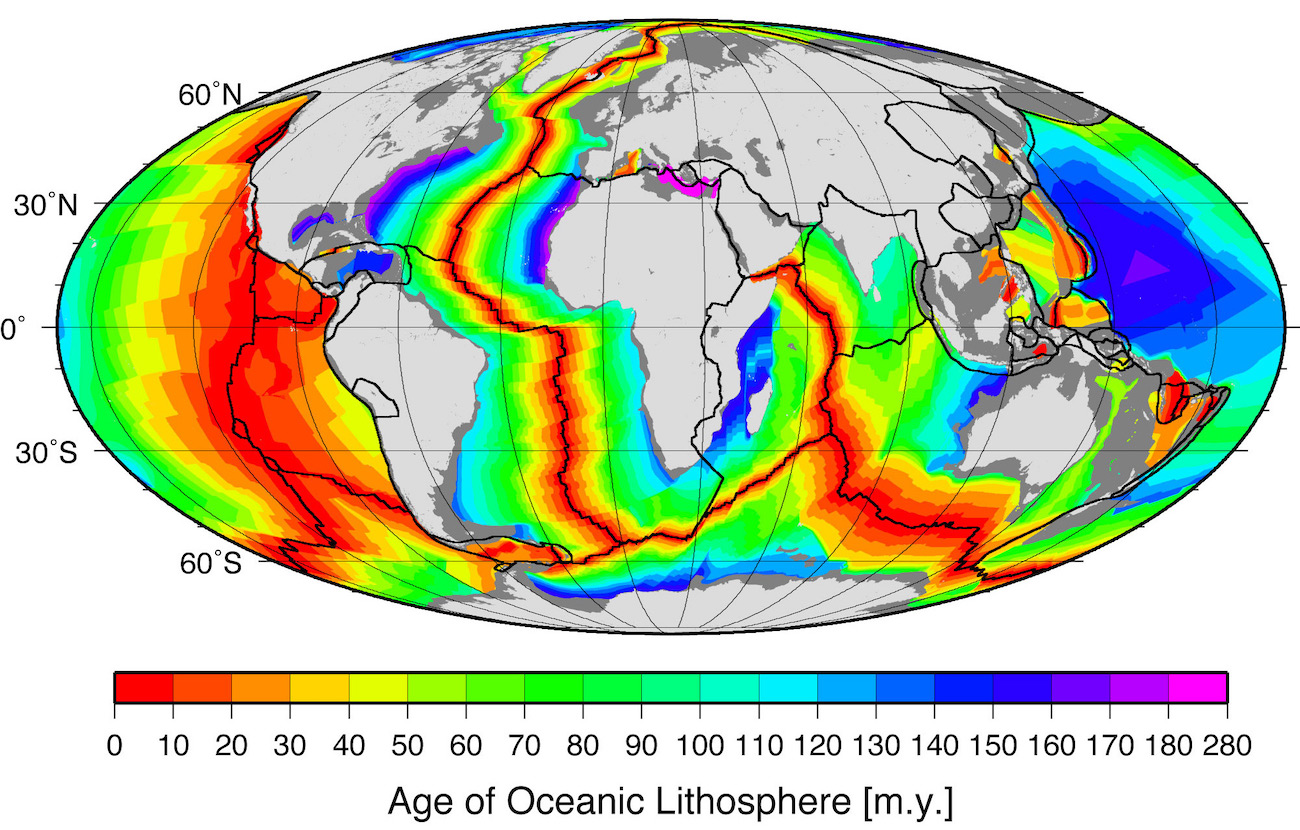
Exercise 3.4 – Investigating Oceanic Lithosphere Age
Use the map of oceanic lithosphere age (Figure 3.6) and the plate boundaries map (Figure 3.2) to answer the following questions.
- Where is the world’s oldest oceanic lithosphere? Describe its tectonic setting.
- Where is the world’s youngest oceanic lithosphere? Describe its tectonic setting.
- Develop a hypothesis that describes what happens to oceanic lithosphere at each of the three types of plate boundaries.
- Compare the age of oceanic lithosphere of the Mid-Atlantic Ridge and the East Pacific Rise. Why does the East Pacific Rise have a wider swath of young oceanic lithosphere?
Geodesy, the science of measuring the Earth’s shape and positions on it, allows the measurement of plate motion directly using GPS, Global Positioning System. Above us is a network of satellites that is more stable than the Earth’s surface, so when a whole continent moves, GPS can detect this movement. Another thing GPS can show is tectonic movements within plates. One assumption behind plate tectonics is that the Earth’s lithosphere is rigid. But some say parts of the plates are mobile, like the Tibetan Plateau and the western American mountain belts. GPS data helps separate blocks that move independently, even if only by a few millimeters per year. In the United States, the Sierra Nevada and Baja California micro-plates have been distinguished this way.
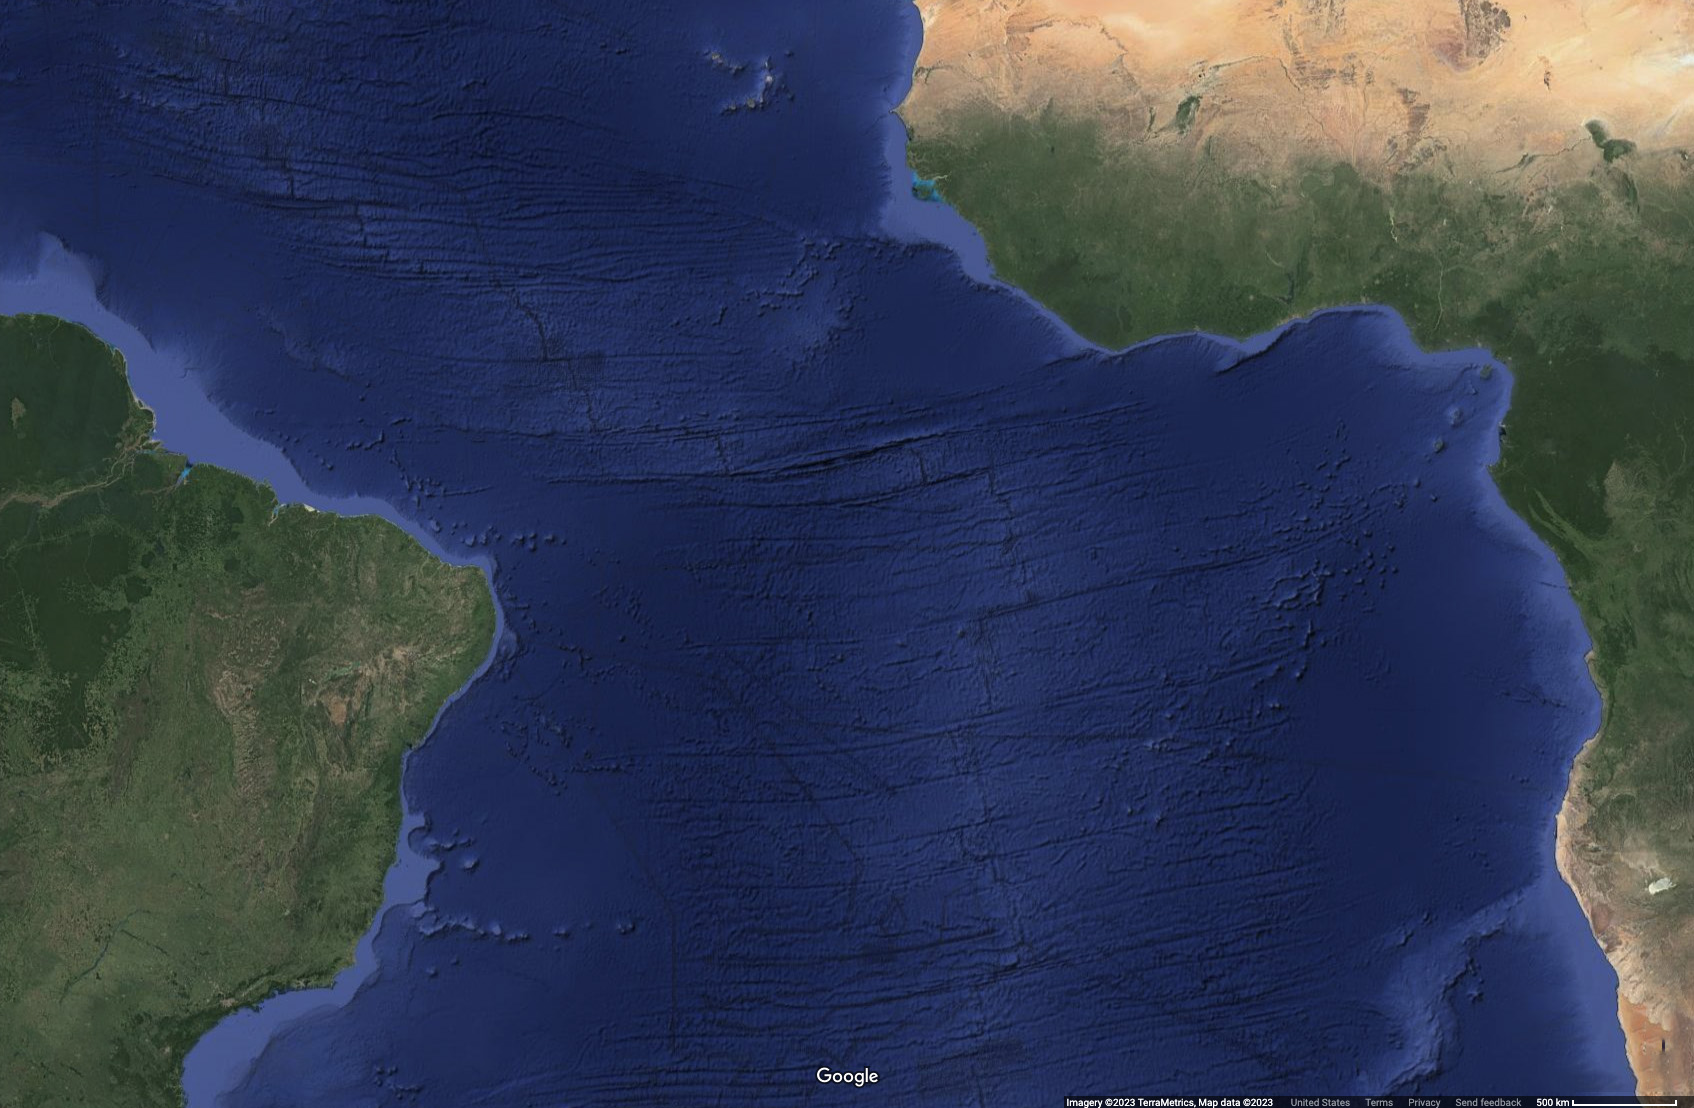
Exercise 3.5 – Measuring Plate Motion
Examine the coastlines of eastern South America and western Africa (Figure 3.7). Notice how well they match in shape?
- Select a point along the coasts of each continent that used to be connected together as part of Pangea. Using the scale bar on the bottom right of Figure 3.6, measure the distance between the two points.
- Distance in kilometers: ____________________
- Distance in miles: ____________________
- This portion of Pangea broke apart about 125,000,000 years ago. Using the distance you measured, calculate how fast (the rate) South America and Africa are separating. (Rate = Distance/Time; 1 km = 100,000 cm; 1 mi = 63,360 in)
- Rate in centimeters/yr: ____________________
- Rate in inches/yr: ____________________
- At the current spreading rate, how many years would it take South America and Africa to move apart another kilometer and mile?
- Years for 1 kilometer of separation: ____________________
- Years for 1 mile of separation: ____________________
This exercise is adapted from Chloe Branciforte and Emily Haddad, CC BY-SA.
3.5 Hotspots
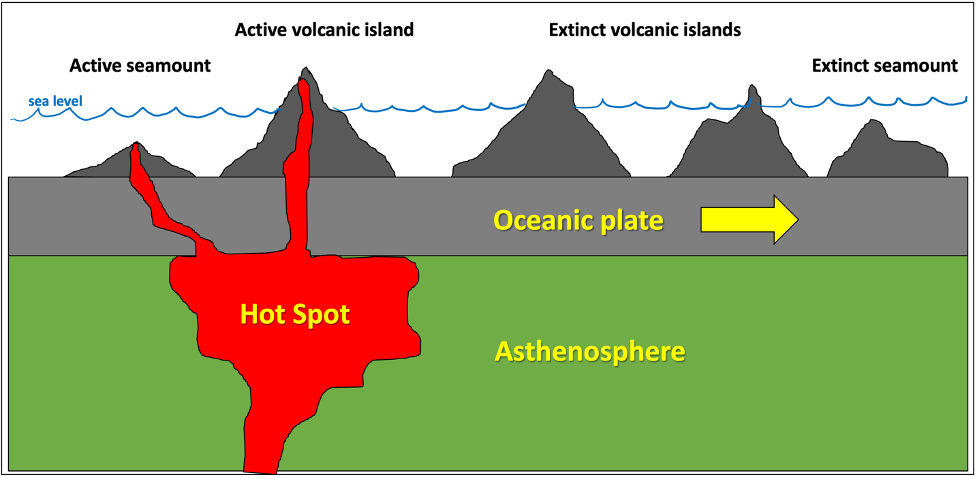
Hotspots are regions where anomalously hot mantle material rises close to the Earth’s surface, causing volcanic eruptions (Figure 3.8). When oceanic lithosphere is over a hotspot, volcanic islands will form, like the Hawaiian Islands. When continental lithosphere is over a hotspot, it can create large continental volcanoes, like Yellowstone National Park.
The accepted understanding of hotpots is that they don’t move, and the tectonic plates move over the hotspot (Figure 3.8). The part of the tectonic plate over the hotspot is volcanically active because it has a magma source, and a volcano grows. When that volcano erupts enough material and rises above sea level, a volcanic island forms. As the island moves away from the hotspot due to the movement of the tectonic plate, that volcano is cut off from its magma source and becomes extinct. Weathering and erosion cause the volcano to shrink in size and become submerged in what is called a seamount (basically an underwater mountain). Recently, though, there has been evidence that suggests hotspots are moving as well.
Exercise 3.6 – Hawaiian Hotspot
In the Hawaiian Islands, only the Big Island of Hawai’i (pronounced Ha-VY-ee in Hawaiian) is volcanically active. The other islands are extinct, but they were active when they were over the hotspot. Use Figure 3.9 to answer the following questions.
- Measure the distance from the big island of Hawai’i to Maui in kilometers and miles. (measure from the center of the islands) ____________________
- Measure the distance from Maui to Moloka’i. ____________________
- Measure the distance from Moloka’i to O’ahu. ____________________
- Measure the distance from O’ahu to Kauai. ____________________
- Go back to each measurement and determine the rate of movement for each time interval in cm/year (rate = distance/time).
- Has the Pacific Plate moved at a constant rate over the past 5 million years (myr)? Explain your observations.
- What is the average movement rate of the Pacific Plate over the past 5 myr in cm/year? ____________________
- In what general direction is the Pacific Plate moving? ____________________

This exercise is adapted from Chloe Branciforte and Emily Haddad, CC BY-SA.
3.6 Seismic Tomography
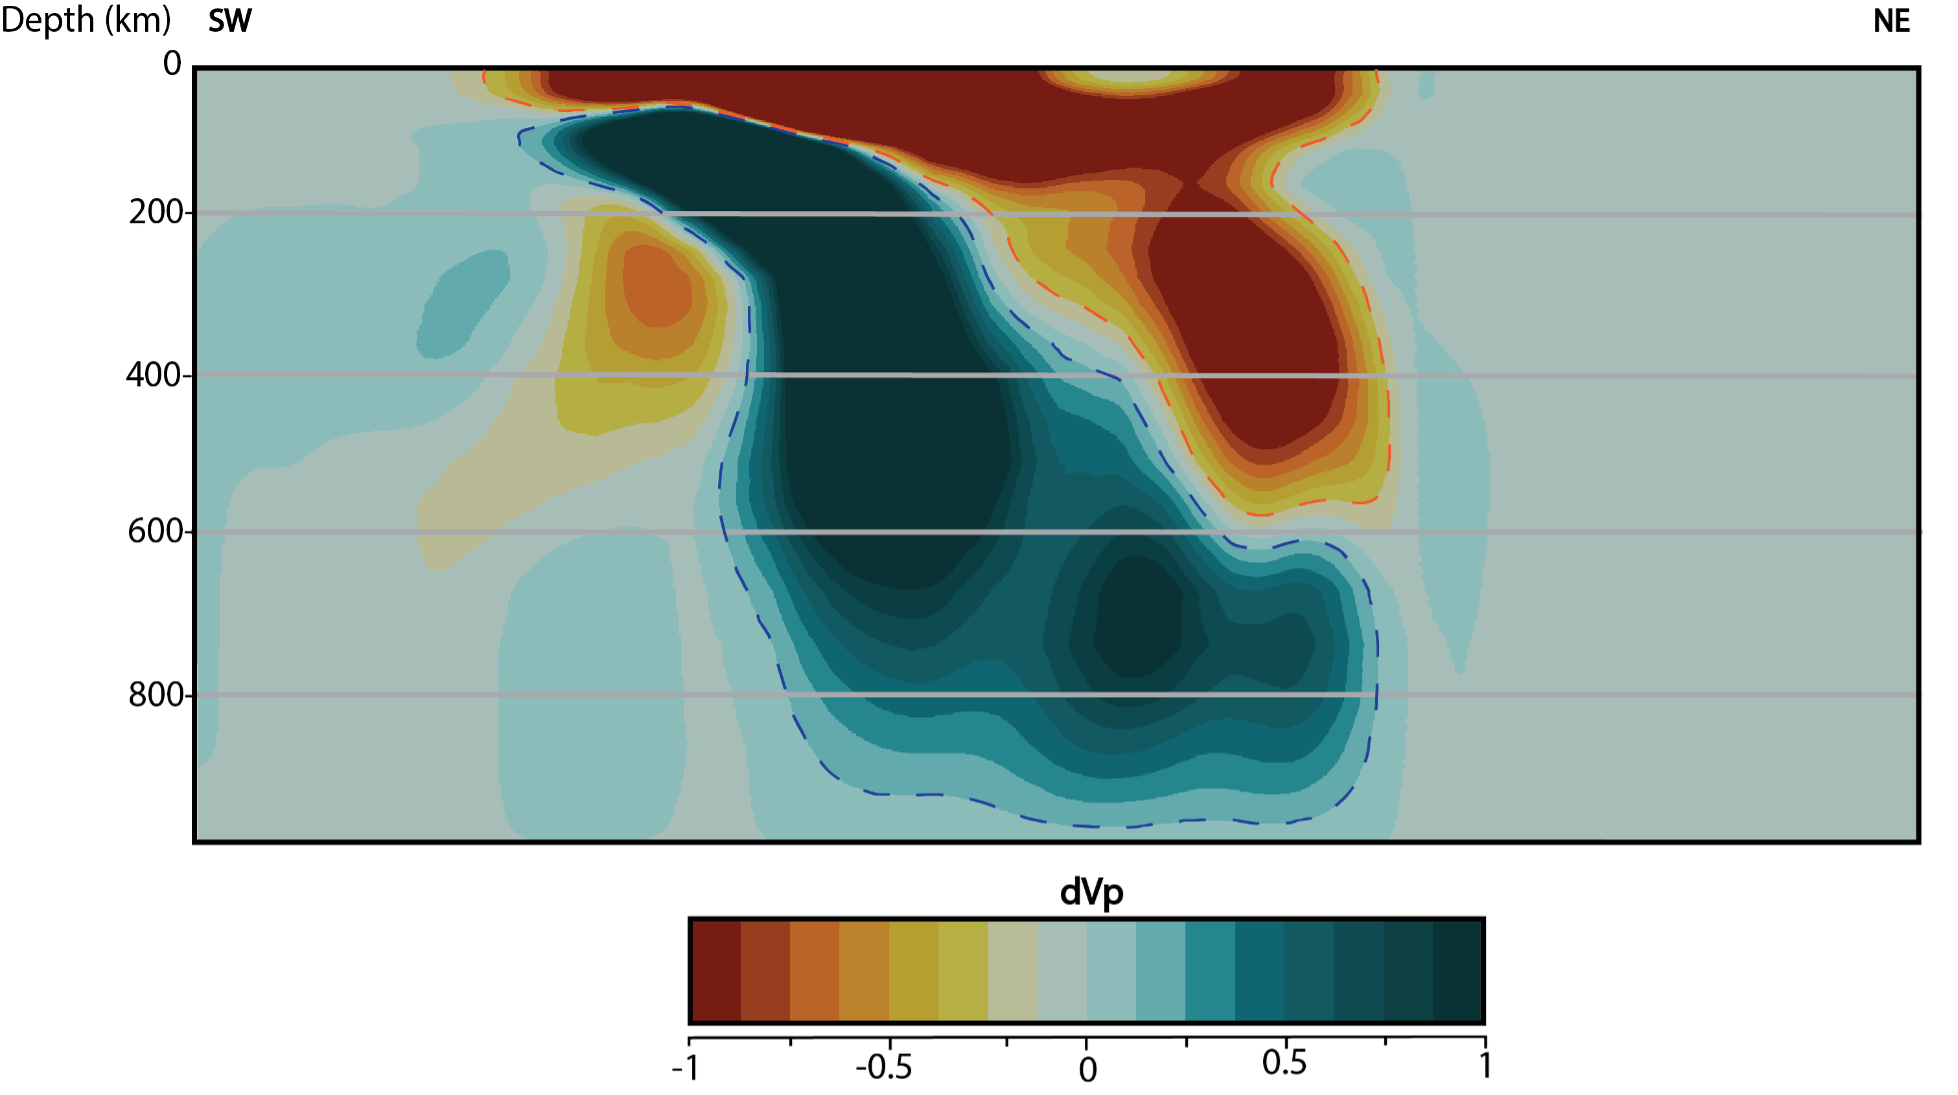
Seismic tomography is a modern geophysical technique used to create 2D- or 3D-computer-generated images of the subsurface of the Earth using seismic waves from earthquakes and explosions. Seismic tomography plays a crucial role in studying the Earth’s mantle. Like doctors using CT (computed tomogrpahy) scans to study parts of the human body, geoscientists use images produced from seismic tomography to study core, mantle, and plate tectonic processes.
Seismic tomography reveals areas of the Earth’s interior where seismic waves travel at velocities that are slower or faster than expected. Color variation in cross-sections generated by seismic tomography represents different seismic wave speeds, which can vary within the Earth. One reason why the speed of seismic waves varies is due to temperature differences in different parts of the Earth (Figure 3.10). A typical tomographic color scale shows:
- Warmer colors (red, orange) in areas where seismic waves have traveled slower than expected. These are interpreted as areas with ‘hotter’ temperatures.
- Cooler colors (blue) in areas where seismic waves have traveled faster than expected. These areas are interpreted as areas with ‘cooler’ temperatures.
Exercise 3.7 – Seismic Tomography
In this exercise, you will use Hades Underworld Explorer to investigate structures in the Earth’s mantle.
- In a web browser, load the Hades Underworld Explorer. Note: Do not use a Firefox browser.
- Navigate to the top right corner of the map window and click on the button titled “Settings (expand)”.
- Check these two boxes: “Show high contrast image” and “Show plate boundaries”.
- Make sure the model is set to “UUP07”. This is under the P-Wave Models on the list of tomography models.
- Utilize both the “Cartesian View” and “Polar View” tabs under the Google Map Explorer to help guide your interpretations.
Part 1:
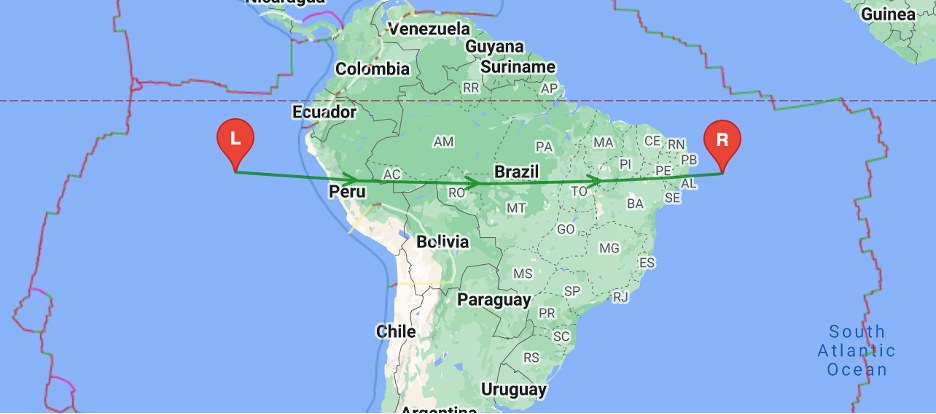
Line up the “L” and “R” cursors with the locations shown in Figure 3.11 as best as possible. Once you have lined up the cursors, use the “Cartesian View” and the “Polar View” in the area below the Google Map Explorer to answer the following questions.
- What type of plate boundary is present? ____________________
- What sort of features can you identify from the tomographic cross-section?
- What is the approximate depth of the blue features in this tomographic cross-section? ____________________
- Describe the geometry of the blue features.
- What do the blue features represent? ____________________
- What is the name of the subducting plate at this boundary? ____________________
Part 2:
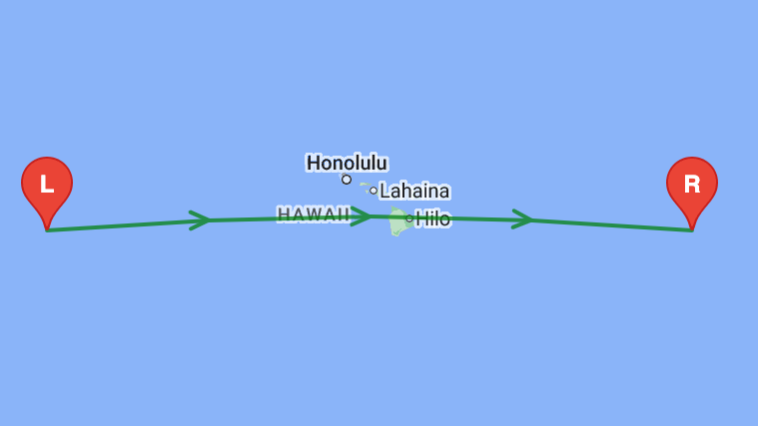
As in the first part, line up the “L” and “R” cursors with the locations shown in Figure 3.12.
- What sort of features can you identify from the tomographic cross-section?
- How do the velocity and temperature differ in this tomographic cross-section compared to the previous tomographic cross-section?
- Describe the depth and geometry of the warm features present in this tomographic cross-section.
Additional Information
Exercise Contributions
Daniel Hauptvogel, Michael Comas, Virginia Sisson, Kaitlin Thomas
a massive, irregularly shaped slab of solid rock, generally composed of both continental and oceanic lithosphere. Plate size can reach up to thousands of kilometers such as the Pacific and Antarctic plates t. Plate thickness ranges from less than 10 km for young oceanic lithosphere to about 200 km or more for ancient continental lithosphere (for example, the interiors of North and South America).
rigid outer layer of the Earth, consisting of crust and upper mantle
the Earth's mantle, below the lithosphere, in which there is plastic flow and convection
the sideways and downward movement of the edge of a plate of the earth's crust into the mantle beneath another plate
an elastic wave in the earth produced by an earthquake or other means
the bulk of Earth's interior. It lies between Earth's core and its thin outer layer, the Earth's crust. The mantle is about 2,900 kilometers (1,802 miles) thick.
the innermost portion of the Earth, lying below the mantle and made of iron and nickel. It is divided into a liquid outer core, which begins at a depth of 2,898 km (1,800 mi), and a solid inner core, which begins at a depth of 4,983 km (3,090 mi)

.svg#file)