
Chapter 6: Igneous Rocks
Learning Objectives
The goals of this chapter are to:
- Characterize and classify igneous rocks
- Analyze volcanic frequency and hazards
- Determine volcanic stratigraphic relationships
You probably already know that igneous rocks form from magma or lava. Did you know that the term is derived from the Latin word “ignis” meaning fire. Before doing this lab exercise, you probably know about basalt and granite, but there is a wide variety of igneous rocks that have unique chemical, mineral, and textural properties, as you just learned in the rock cycle exercises. Many have been fascinated by igneous rocks as they make up mountains, particularly volcanos. These are eruptions can be devastating, such as the Vesuvius eruption in 79 A.D. that buried Pompeii or 1815 eruption of Tambora, which caused global climate change for several years. Geoscientists study them to insights into the lower crust and upper mantle as well as tectonic processes. Nowadays, they are investigated as sources of lithium for batteries and rare earth elements for magnets for computers and cell phones.
6.1 Igneous Rocks and Earth’s Layers
Exercise 6.1 – Observing Igneous Rocks
Your instructor has provided you with a set of igneous rocks. Continuing with our ideas of classification, sort these rocks into groups based on any criteria you want to use. Your instructor may ask you to re-classify the materials several times using different criteria.
- Which criteria did you use? Why?
b. Did you need to reclassify your samples? If so, which criteria changed?
During the rock cycle exercises, you learned that sedimentary rocks are the most abundant rock type on Earth’s surface, but most of the crust and upper mantle are composed of igneous rocks. You might remember learning these layers formed early in Earth’s history through the process of chemical differentiation, when denser elements sank towards the center of the Earth and less dense elements floated toward the surface. This led to density differences between the layers as well as chemical differences.
Exercise 6.2 – Determining the Density of Earth’s Layers
Your instructor has presented you with three examples of Earth’s layers: oceanic crust, continental crust, and the upper mantle. We’re not worried about the names of the rocks at this point, just the observations you make.
- Describe the differences between the three rocks.
- Measure the density of each sample as you did at the end of Chapter 1. Weigh each sample and record the mass, then record how much water is displaced when you place it in a graduated cylinder. Fill out table 6.1.
Table 6.1 – Density calculation Rock Mass (g) Volume (cm3) Density (g/cm3) - How do your measured densities compare with your observations in a?
- What do you think causes the varying densities of these rocks?
- On Figure 6.1, show where these rocks could come from.
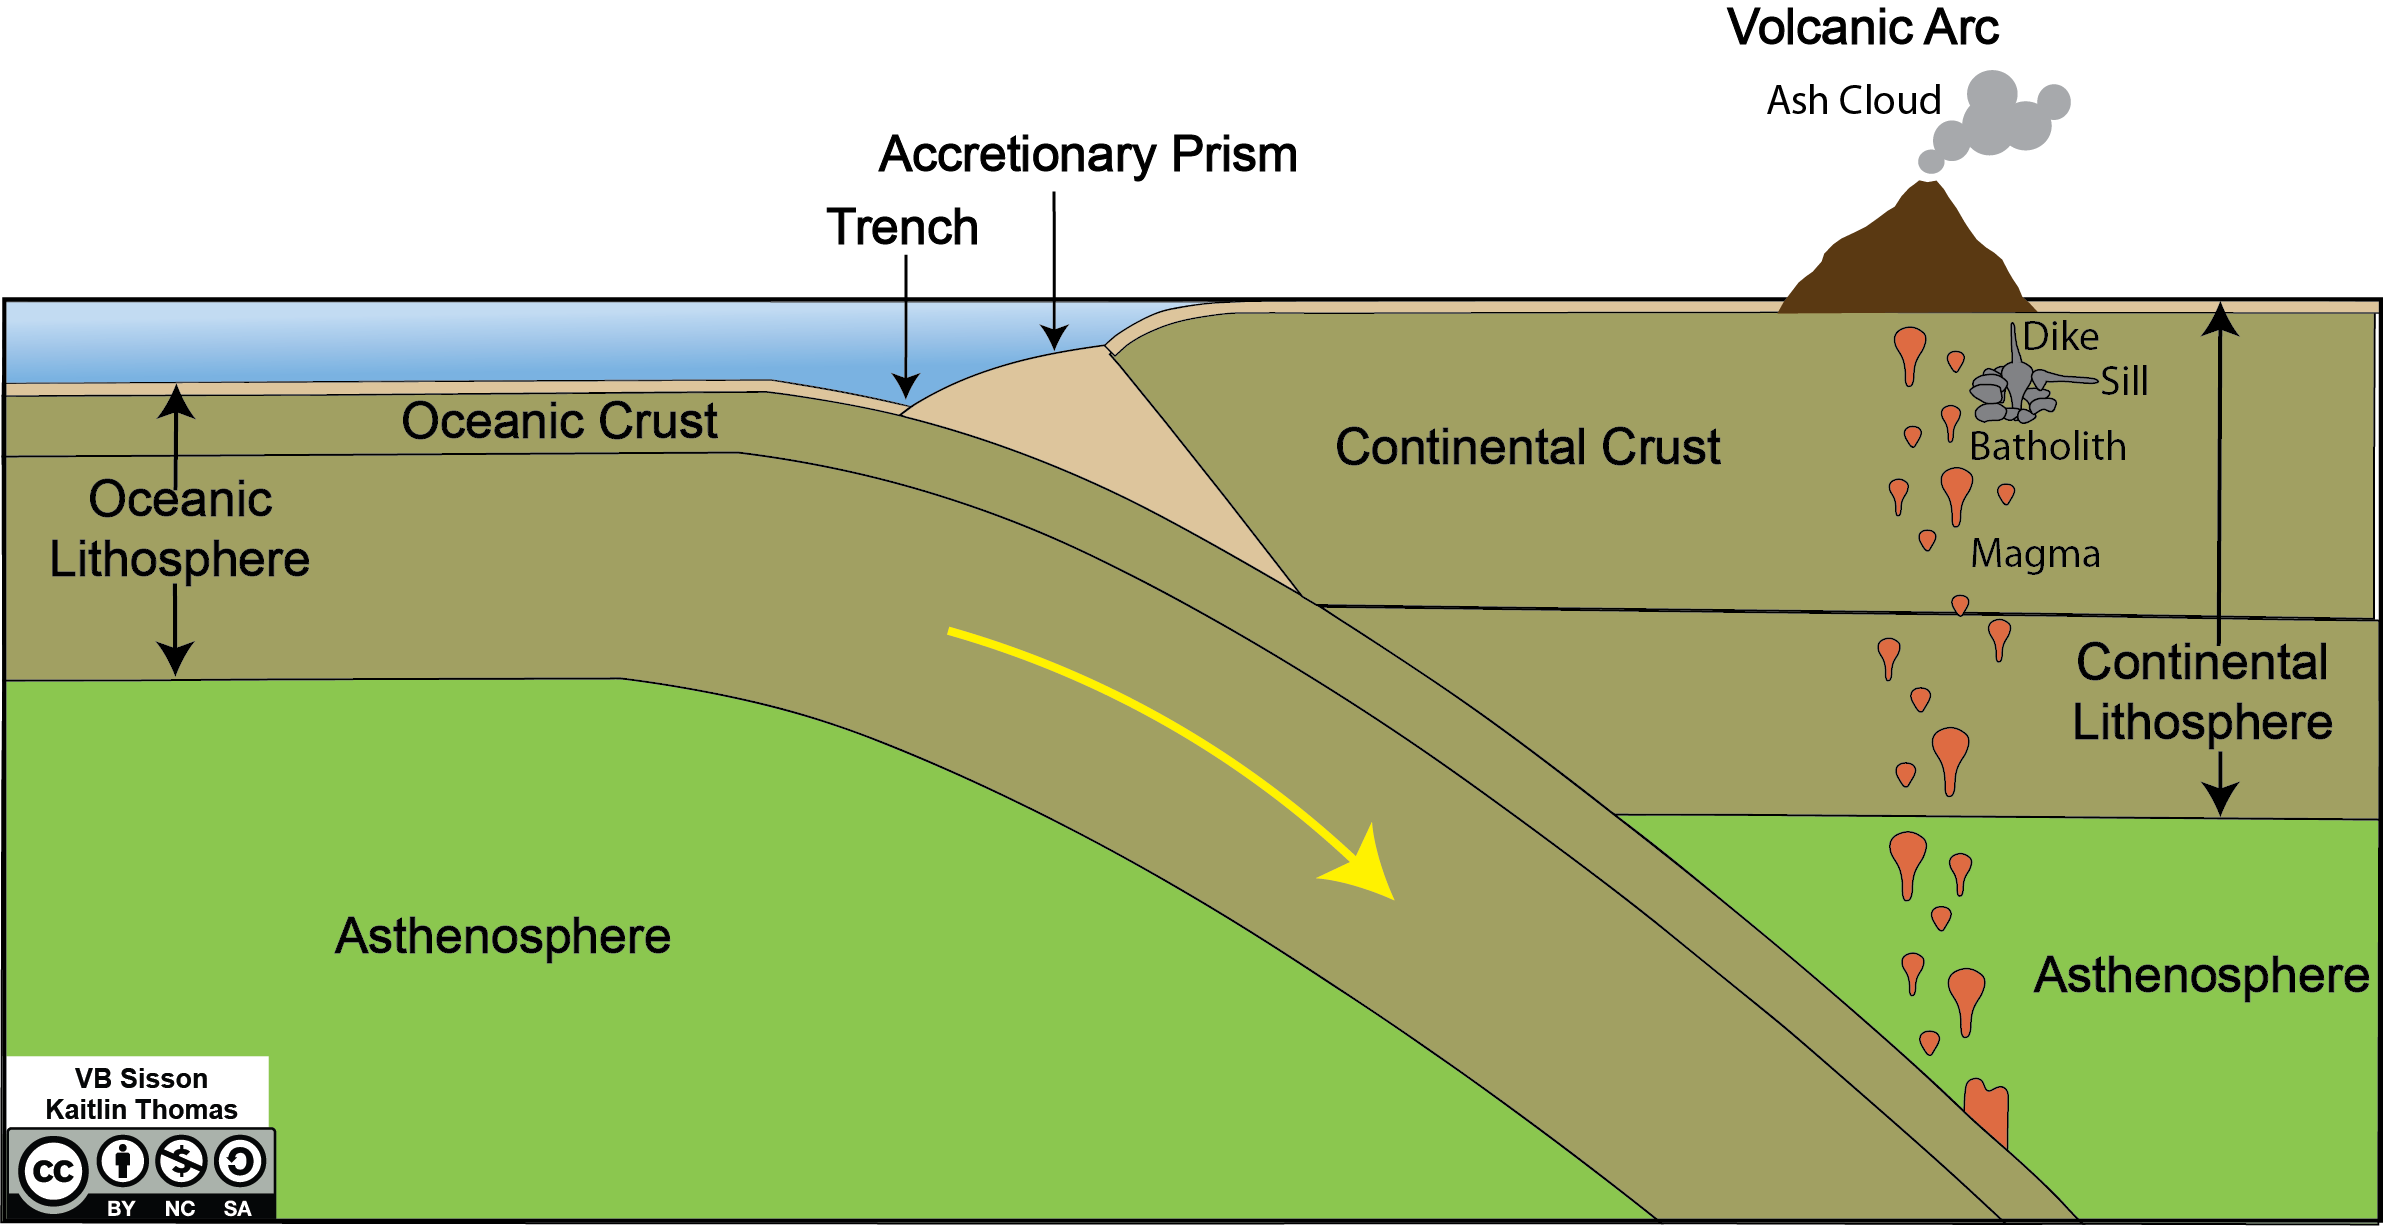
Figure 6.1 Schematic cross-section of an ocean-continent convergent zone. Subduction direction of oceanic crust is shown by yellow arrow. Not to scale as vertical scale is exaggerated. Sedimentary rocks shown in tan, crust in dark gray, lithosphere in olive gray with asthenosphere in green. Magmas as orange and intrusive rocks in gray. Extrusive rocks in brown. Image credit: Virginia Sisson and Kaitlin Thomas, CC BY-NC-SA.
6.2 Igneous Rock Classification
The classification of igneous rocks is based on texture and composition of the rock. Texture refers to how large or small the mineral grains are, and composition refers to which minerals are present..
Texture
The size of mineral grains in igneous rocks is primarily determined by how quickly the magma cools. Slow cooling rates (thousands to half a million years) make larger mineral grains. Slow cooling rates are common in the crust and upper mantle, creating intrusive (plutonic) igneous rocks. Fast cooling rates (instantaneous to hundreds of years) occur when lava is at the surface and produces smaller grains, creating extrusive (volcanic) igneous rocks. The distinction between fine and coarse grains is whether you can identify the minerals without magnification. This is important because two different rocks can have the same composition, but different textures. For example, diorite (large grains, intrusive igneous rock) and andesite (small grains, extrusive igneous rock) have the same minerals but different textures.
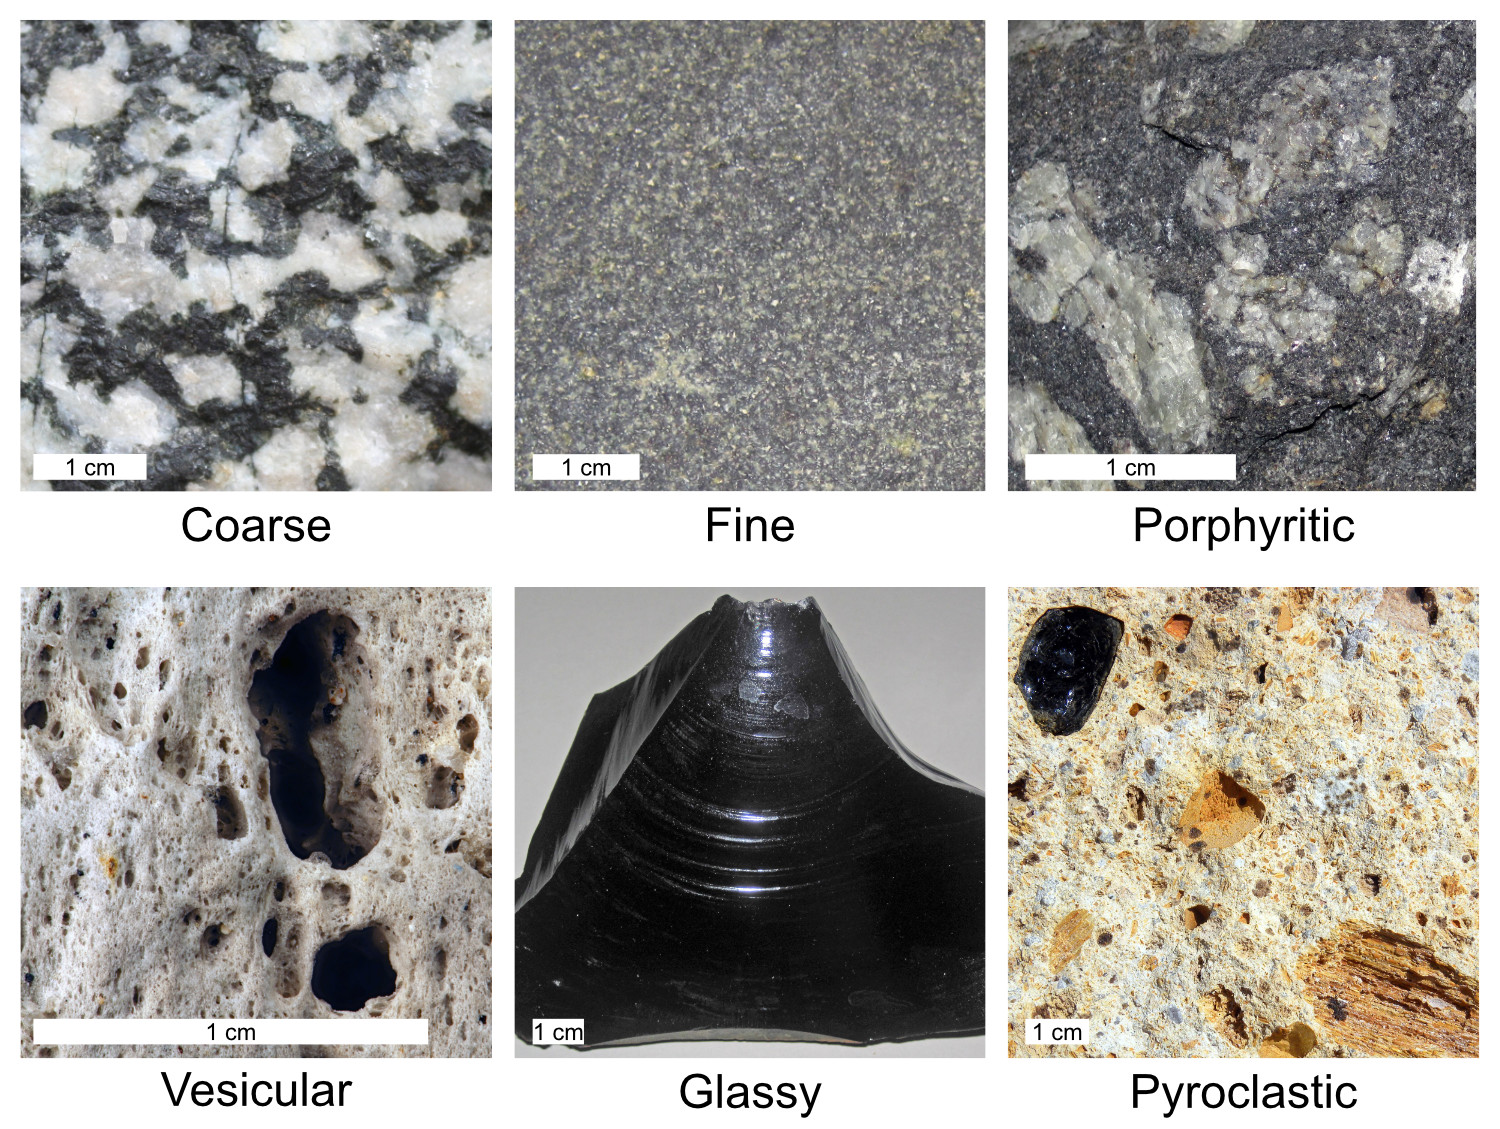
The common textures of igneous rocks (Figure 6.2) are:
- Coarse (phaneritic) – grains are large enough to identify without magnification, indicative of slow cooling; intrusive rocks
- Fine (aphanitic) – grains are too small to identify without magnification, indicative of fast cooling; extrusive rocks
- Porphyritic – grains are a mixture of coarse and fine grains, indicative of two cooling rates, slow at first (intrusive) and then fast (extrusive)
- Glassy – very smooth texture with no minerals, cooled so quickly that minerals did not have time to form, commonly has conchoidal fracture; extrusive rocks
- Vesicular – rough, porous texture, cooled quickly, vesicles (holes) created from abundant gas in the lava; extrusive rocks
- Pyroclastic – angular rock fragments with fine ash ejected during volcanic eruptions.
Exercise 6.3 – Igneous Rock Textures
Texture is the first component to identifying igneous rocks. Use Figure 6.2 to help identify the texture of your igneous rock samples in Table 6.2.
| Texture | Rock Sample Numbers |
| Coarse (intrusive) | |
| Fine (extrusive) | |
| Porphyritic | |
| Glassy | |
| Vesicular | |
| Pyroclastic |
Composition
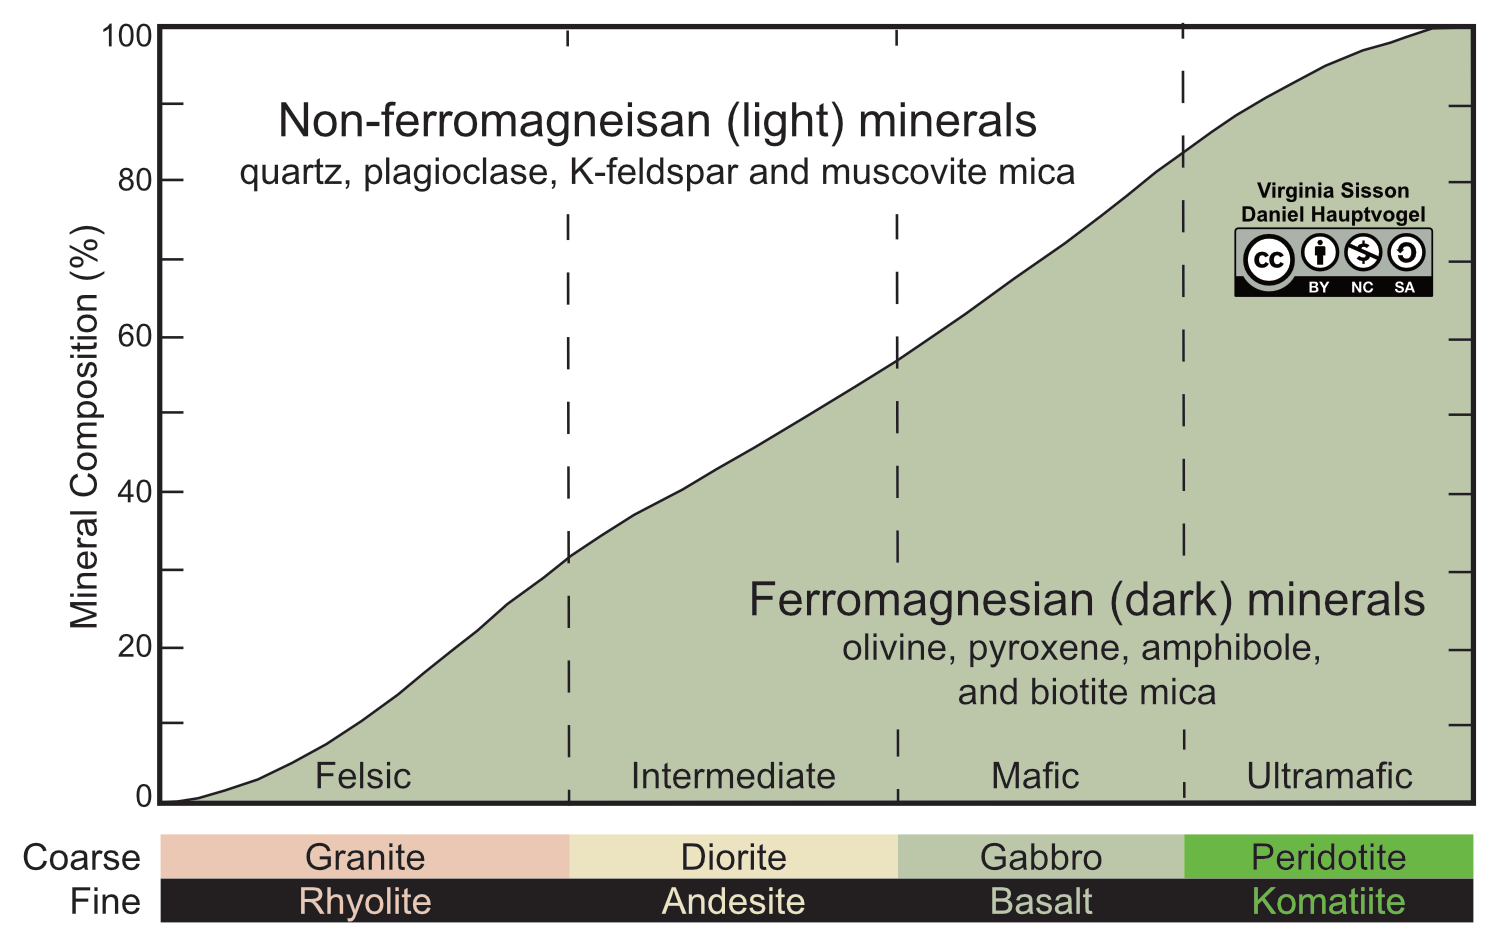
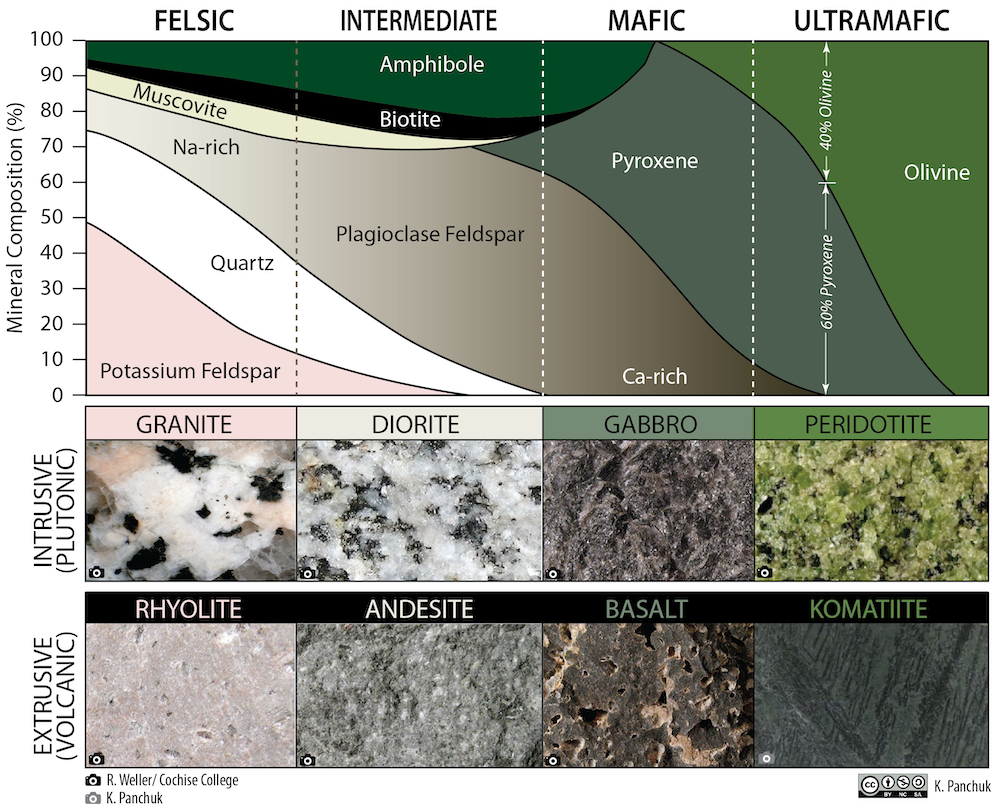
The composition of an igneous rock is determined by the chemistry and temperature of the magma it formed from. There are eight common minerals in igneous rocks, which can be separated into four different igneous compositions: ultramafic, mafic, intermediate, and felsic (Figure 6.3). Identifying minerals in rocks is not easy for a beginner geologist, and identifying minerals in fine-grained rocks is impossible without magnification, but there are a few tricks that geologists use to identify the composition. Do you remember how color was not a diagnostic property for minerals? Well, color in an igneous rock can be diagnostic! Iron and magnesium-bearing minerals are either black or green in color, like olivine and pyroxene, and they are the primary minerals that make up mafic and ultramafic igneous rocks. Potassium, aluminum, and silica-rich minerals, like quartz and potassium feldspar, are lighter in color and make up intermediate and felsic igneous rocks. Geologists can use the color of igneous rocks or the relative amount of light- vs. dark-colored minerals (Figure 6.4) to help identify the rock’s composition.
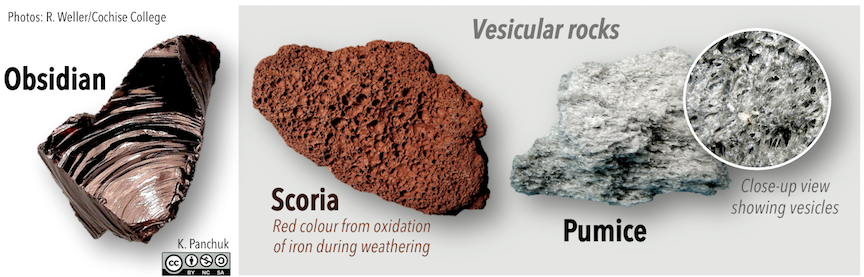
It can be difficult to determine the composition of glassy and vesicular textures. (Figure 6.5). These textures form when lava cools off too quickly for minerals to form. The conchoidal fracture in obsidian tells us that it has a high silica content (felsic) despite its dark color. The dark color comes from the tiny amount of iron present. Scoria, a vesicular rock, is mafic and gets it’s dark coloring from the iron present, whereas pumice is typically felsic and lighter in color. Scoria is also denser than pumice, and some pumice can float in water.
Exercise 6.4 – Igneous Rock Composition
Composition is the second component to identifying igneous rocks.
-
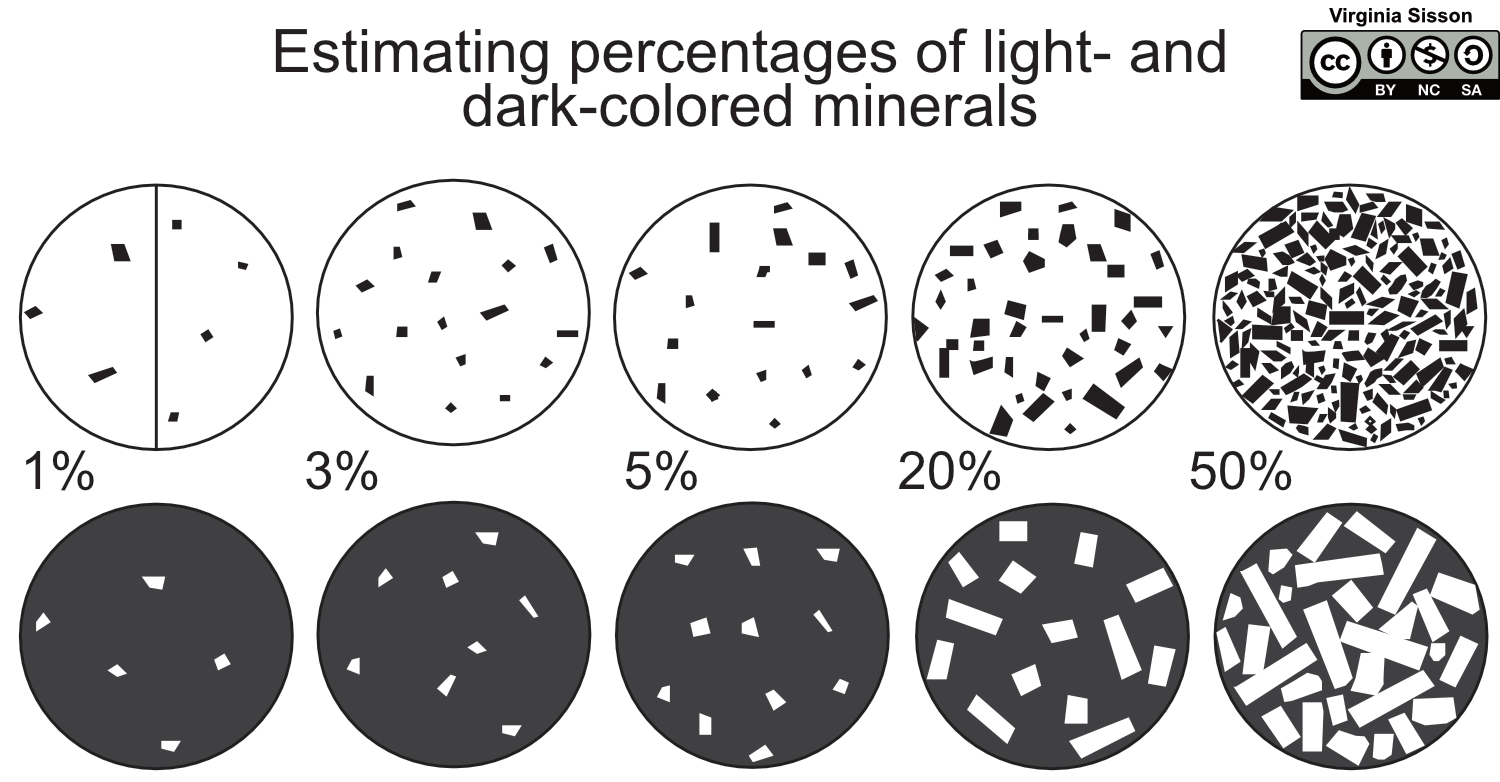
- Determine the color of your igneous rocks. For fine-grained rocks, geologists use terms like dark, gray, or light (white/tan/pink). For coarse-grained rocks, use the percentage of light vs. dark-colored minerals.
Table 6.3 – Color in your igneous rocks Rock Sample Color for fine-grained rocks % light vs. dark minerals for coarse-grained rocks - Table 6.3 contains a list of some common igneous minerals. Determine which of your coarse-grained rocks contain these minerals. Sample numbers can be used more than once.
Table 6.4 – Minerals in your coarse-grained rocks Minerals Rock Sample Numbers Quartz Feldspar Amphibole, Pyroxene, or Mica Olivine - Use Figures 6.3 and 6.4 to identify the composition of your igneous rock samples. Write your answers in Table 6.4.
Table 6.5 – Igneous composition Composition Rock Sample Numbers Felsic Intermediate Mafic Ultramafic
- Determine the color of your igneous rocks. For fine-grained rocks, geologists use terms like dark, gray, or light (white/tan/pink). For coarse-grained rocks, use the percentage of light vs. dark-colored minerals.
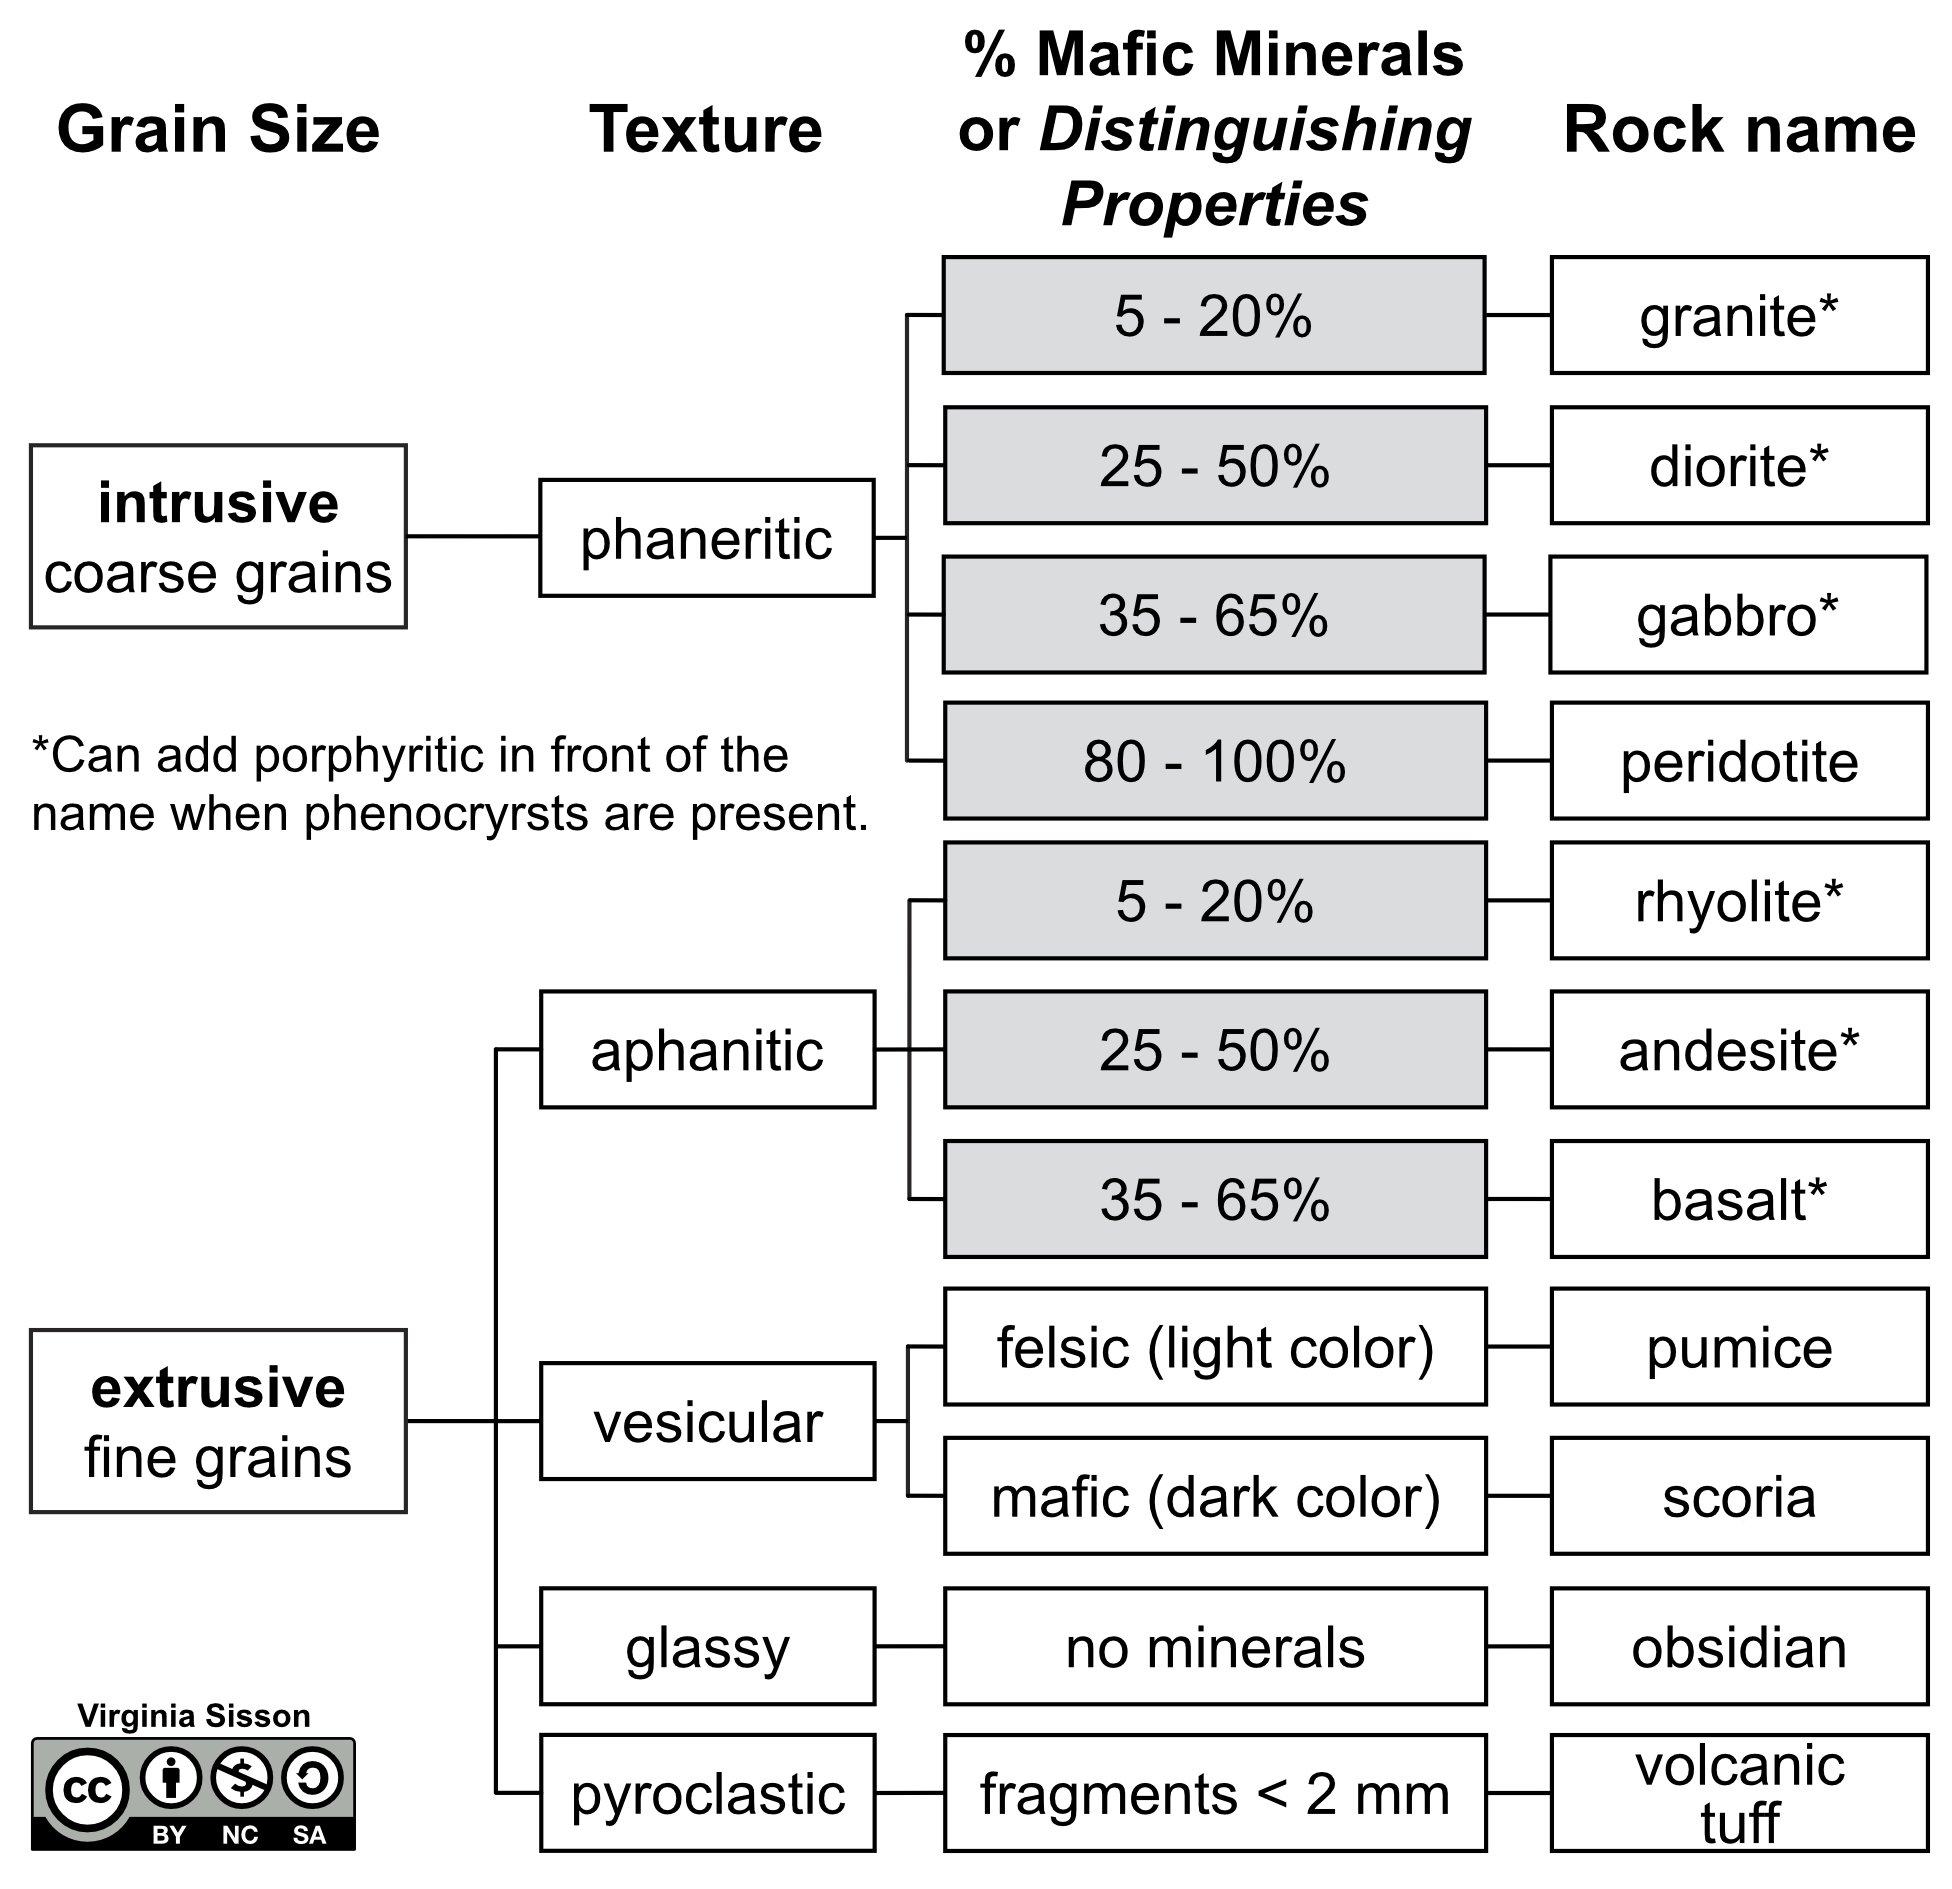
One of the obstacles to discussing rocks are classification schemes that emphasize rock names. Historically, geoscientists who study rocks have used 100’s of names. But, don’t panic as we want you to learn how to observe their important features and not obsess over their names. Just like the minerals chapters, our approach is to emphasize observtions you need to make and won’t worry about whether you can identify a rock as an ankaramite (a type of basalt with clinopyroxene that one of the authors worked on in Venezuela) or another obscure rock name. For igneous rocks, we have whittled it down to only eleven common names and based mostly of composition and a few others that have unique textures (Figure 6.6).
Exercise 6.5 – Igneous Rock Identification
Using your previous data from Tables 6.3-6.5 and Figures 6.6-6.7 to identify your set of unknown igneous rocks. Fill in the table in Table 6.6.
| Sample | Texture | Composition | Minerals or % light vs. dark | Rock Name |
6.3 Creating Magma
The temperatures needed to melt a rock to create magma are between 600 and 1,300 oC (1,100 and 2,400 oF), depending on the rock’s composition and its depth (pressure). With normal temperature gradients in Earth, it is almost impossible to reach these temperatures. In your lecture class, you’ll learn about decompression melting and fluid-assisted melting. It is impossible to demonstrate these in a lab setting. We can, however, simulate one melting process which results in creation of magmas.
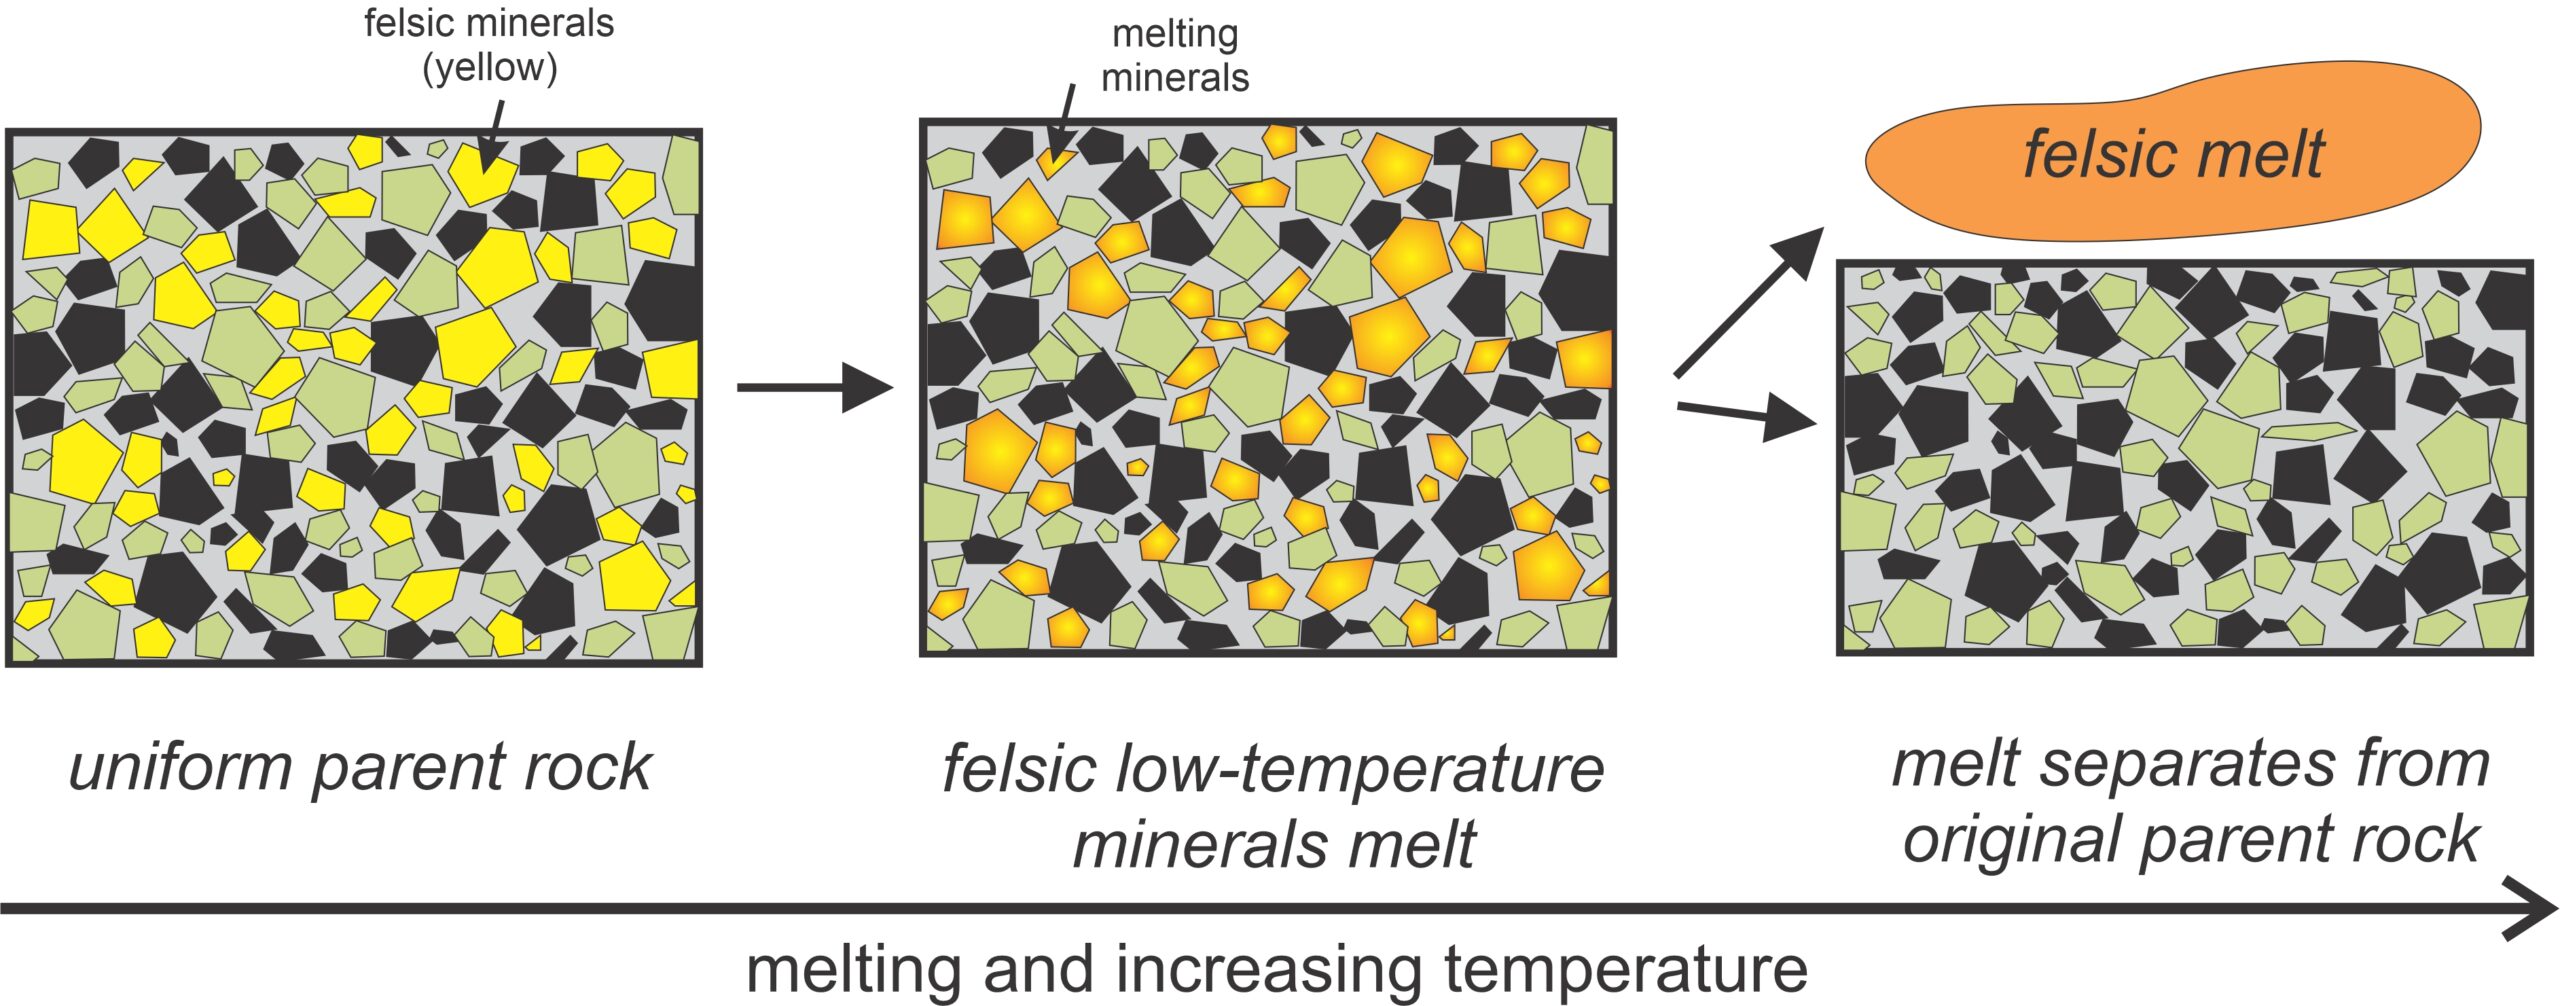
Partial melting is when some minerals in a rock melt before others do. Most rocks are made up of different minerals, and each mineral has a different melting temperature. In general, minerals with more silica will melt before those with less silica (Figure 6.8). During partial melting, minerals with lower melting points will melt first; while minerals with higher melting points remain solid. The melt (magma) composition is “enriched” with the minerals that have melted, and the remaining solid (rock) is “depleted” in the minerals that have melted. For example, if a mafic rock undergoes partial melting, the magma created is intermediate. The resulting magma has more (enriched in) silica, and the remaining rock has less (depleted in) silica.
Exercise 6.6 – Partial Melting
Let’s construct an analog for partial melting.
- Place a scoop of cookie dough or chocolate chip ice cream into a beaker. Place the beaker on a heat source and slowly increase the temperature. What happens to the ice cream when compared to the cookie dough chunks and/or chocolate chips?
- Is your melt depleted or enriched in ice cream?
- Is your solid depleted or enriched in ice cream?
- Critical Thinking: If the chocolate chip ice cream represents a diorite, what minerals chocolate chips represent? What type of magma (melted ice cream) is generated?
6.4 Tectonic Setting of Magmas
Magmas can be found in every modern plate tectonic setting as well as within plate interiors. Some magmas occur in every tectonic setting, such as mafic rocks (basalt and gabbro), which occur in all three tectonic settings as well as hotspots. The minerals or textures of igneous rocks cannot determine their plate tectonic setting. Instead, geoscientists use the chemistry of the magmas. In lecture, you may have discussed how the silica (quartz or SiO2) content decreases from felsic to ultramafic rocks. There are also changes in mineral abundances. These differences are reflected as changes in the rock chemistry. Additionally, since each mineral may contain trace elements, different magmas exhibit variable trace element chemistries. Geoscientists have created a worldwide database of igneous rock chemistries, EarthChem. Using this data, they can relate the chemistry of the magma to various plate tectonic settings.
Exercise 6.7 – Determining their Tectonic Setting
Often, igneous rocks are too fine grained to determine their rock type, let alone their tectonic setting. Your TA will share a table with selected chemical data for igneous from nine locations around the globe. Each person or group will analyze data from three locations. You can analyze data based on age groups of young (<0.1 Ma), intermediate (54-470 Ma), or old (2.7-3.3 Ga). Or analyze a data set from each age group. All of this chemical data is from the EarthChem web page.
- First, all scientists love to use acronyms. What is the tectonic setting for the three acronyms (ARC, MORB, and OIB) in Figure 6.9?
- Describe the differences and similarities between the three data sets you will analyze.
- On Figure 6.9, plot the data for your three data sets. You should use either different colors or types of symbols (circles, triangles, and crosses) to distinguish the data sets.
Figure 6.9 Log-Log plot of titanium (Ti) and vanadium (V) concentrations. The tectonic environments are divided by their Ti/V ratio shown as diagonal dashed lines for ratios of 10, 20, and 43. Tectonic environments include island arcs (ARC), mid-ocean ridges (MORB), and ocean island basalts (OIB). Image credit: Virginia Sisson CC BY-NC-SA with tectonics fields adapted from Shervais (2022). - Calculate the average for each data set and plot this with a different symbol on Figure 6.9.
- Does all of your data plot within one plate tectonic setting? ____________________
- If you need to look back at Figure 1.3. Do you think your data set is precise, accurate, both, or neither? Discuss how this affects your interpretation of the tectonic setting.
- What other factors may influence the geochemistry of an igneous rock?
- Critical thinking: Do you think age affects how you interpret an igneous rock’s tectonic environment? Consider when plate tectonics began on Earth.
6.5 Volcanoes
Volcanic eruptions are one of Earth’s most dramatic and destructive agents of change. Powerful explosive eruptions drastically alter land and water for tens of kilometers around a volcano. Also, droplets of sulfuric acid erupting into the stratosphere can temporarily change Earth’s climate. Volcanic eruptions often force people living near volcanoes to abandon their land and homes. Those living farther away are likely to avoid complete destruction, but these cities and towns, crops, industrial plants, transportation systems, and electrical grids can still be damaged by tephra, ash, lahars, and flooding.
Fortunately, volcanoes often exhibit unrest that allows eruptions to be anticipated and warnings sent to at-risk communities. The warning time preceding volcanic events typically allows sufficient time for nearby communities to implement response plans. Another way to predict future eruptions is to investigate the past eruptive history of a volcano.
Exercise 6.8 – Volcano Eruption Frequency
Some people have suggested that the number of volcanic eruptions is increasing and contributing to climate change. Let’s look at some data. Table 6.7 shows the number of volcanic eruptions worldwide from 1992 to 2008.
| Year | Number of Eruptions |
| 1992 | 27 |
| 1993 | 27 |
| 1994 | 32 |
| 1995 | 33 |
| 1996 | 35 |
| 1997 | 26 |
| 1998 | 32 |
| 1999 | 39 |
| 2000 | 39 |
| 2001 | 33 |
| 2002 | 41 |
| 2003 | 29 |
| 2004 | 49 |
| 2005 | 46 |
| 2006 | 44 |
| 2007 | 36 |
| 2008 | 45 |
- Plot the volcanic eruption data from Table 6.7 on the blank graph in Figure 6.10.
- Do you think there is a trend in this data? Have the number of volcanic eruptions per year been increasing? Explain.
Sometimes people interpret data without looking at the big picture, either accidentally or by cherry-picking data points that support their point. You were only given a subset of the volcanic eruption data in Table 6.7.
- Table 6.8 contains the remaining data from the years before and after the data you plotted. Plot this new data on the same graph in Figure 6.10. You can use a different color if you’d like.
- Do you think there is a trend now that you have the complete data set? Have the number of volcanic eruptions been increasing, decreasing, or about the same? Explain.
| Year | Number of Eruptions | Year | Number of Eruptions |
| 1960 | 35 | 1984 | 33 |
| 1961 | 32 | 1985 | 27 |
| 1962 | 29 | 1986 | 41 |
| 1963 | 40 | 1987 | 32 |
| 1964 | 29 | 1988 | 27 |
| 1965 | 34 | 1989 | 25 |
| 1966 | 35 | 1990 | 30 |
| 1967 | 43 | 1991 | 37 |
| 1968 | 32 | ||
| 1969 | 32 | ||
| 1970 | 34 | 2009 | 31 |
| 1971 | 32 | 2010 | 33 |
| 1972 | 30 | 2011 | 36 |
| 1973 | 41 | 2012 | 39 |
| 1974 | 27 | 2013 | 38 |
| 1975 | 23 | 2014 | 42 |
| 1976 | 29 | 2015 | 41 |
| 1977 | 39 | 2016 | 34 |
| 1978 | 25 | 2017 | 32 |
| 1979 | 32 | 2018 | 37 |
| 1980 | 41 | 2019 | 27 |
| 1981 | 29 | 2020 | 27 |
| 1982 | 32 | 2021 | 33 |
| 1983 | 32 | 2022 | 31 |
The volcanic eruption data is from the Smithsonian Institution Global Volcanism Program.
Geologists monitor most of the world’s volcanoes for eruptive activity, but how can past eruptions be determined, especially for events before human memories? The simplest way is to look at a detailed map around a volcano. With each eruption comes a new layer of lava that turns to igneous rock. By mapping out the igneous rocks, you can determine the volcano’s eruptive history. One of the most visited volcanoes is the Big Island of Hawaii, which is actually made up of several volcanoes, with Kīlauea being the most active today. The oldest eruption on the island started about 1 million years ago and it may be actively erupting as you read this (Figure 6.11).
Exercise 6.9 – NASA Volcano Mapping
Volcanic mountains grow through successive eruptions of lava and other volcanic materials. Each eruption creates a new layer of rock, slowly raising the peak’s elevation. In this exercise, you’ll create your own volcano and map each eruption. This exercise is from NASA JPL. See their step-by-step instructions for images of each step.
Creating a volcano:
- Use the bottom half of a petri dish.
- Place it in the center of graph paper and trace around it with a pencil (this is your map).
- Use a paper plate and mark north, south, east, and west on its edges and then mark north on your graph paper. This will help you remember the order of events in geographic coordinates.
- Fill the petri dish with baking soda.
- Place a small amount of vinegar into the petri dish and watch the eruption of simulated lava. If it doesn’t flow, add more vinegar.
- When the lava stops, quickly draw around the flow edge with a pencil.
- Dab up the fluid with paper towels.
- Use a thin layer of play dough to cover the entire area where lava flowed.
- On one piece of graph paper, use a colored pencil that matches the play dough color to draw an outline representing the edge of the play dough, being sure to maintain the cardinal orientation (north, south, east, west) of the paper with the orientation of the volcano. Shade in this lava flow drawing. Make a note on the graph paper regarding the order of eruptions (which color came first).
- Repeat the eruption process to create a total of 4 to 6 flows.
- Trade your volcano with another group (keep your map).
Now that you have another group’s volcano, imagine yourselves as a team of geologists seeing a volcano for the first time. Your job is to investigate and map this volcano that has an unknown history.
- Grab another piece of graph paper and mark north.
- Draw the visible layer(s) of the volcano to scale on the graph paper using a ruler and colored pencils.
- How many lava flows can you see? ____________________
- Make a list of the lava flows, starting with the youngest flow at the top and the oldest at the bottom. Example: “Top flow is a long, skinny, green flow.”
- Can you easily determine the sequence of flows (which came first, second, etc.)? Are there some flows you can’t say which are younger or older? Explain.
- Are there parts of any flows that might be covered? Which ones?
- What would you need to determine the sequence and shape of each flow? How could you get that information without lifting the play dough?
Stop here and wait for your instructor before continuing.
- Complete the remaining steps outlined by your instructor. Record the locations and information gained on your map and finish it. What is the sequence of flows that tells the history of this volcano?
- Compare your map and sequence of flows with the one from the group that originally made the volcano. Was your interpretation accurate? Explain.
If you want to live near a volcano, knowing the types of hazards is critical to evaluate the risks you’ll be taking. Some volcanoes are dormant or extinct and no longer hazardous. Most countries with active volcanoes monitor their potential hazards. Active volcanoes are monitored for seismic activity (earthquakes), gases, deformation of the ground, gravity, magnetics, and thermal imaging. You can go to the Global Volcano Network to assess recent activity around the world.
Exercise 6.10 – Reading a Volcanic Hazard Map
Mount Rainier (Figure 6.12) is considered a dangerous volcano due to the type of volcano it is, its elevation, year-round snow/ice at its peak, and its proximity to the heavily populated regions of Tacoma and Seattle Washington that have almost 5 million people. Figure 6.13 contains a colored digital elevation model and a hazard map of the Mt. Rainier region in Washington State; Seattle is located near Puget Sound just north of the map.
- Do lava flows and pyroclastic flows pose a significant risk to the surrounding population? Explain
- What do you notice about the path lahars tend to follow in this region?
- How far can these lahars travel? Measure on the map.
- What could cause the failure of the Alder Dam and subsequent flooding (located on the western side of the map near the town of Elbe)?
- Critical Thinking: What do you think is the source of water for the lahars?

Additional Information
Exercise Contributions
Daniel Hauptvogel, Virginia Sisson, Kaitlin Thomas
Reference
Shervais, J, 2022, The petrogenesis of modern and ophiolitic lavas reconsidered: Ti-V and Nb-Th, Geoscience Frontiers, 13, 101319, https://doi.org/10.1016/j.gsf.2021.101319
size, shape, and arrangement (or fabric) of the mineral grains and crystals
Ultramafic rocks are igneous and meta-igneous rocks with a very low silica content (less than 45%), generally >18% MgO, high FeO, low potassium, and are composed of usually greater than 90% mafic minerals.
Mafic rock is silicate mineral or igneous rock rich in magnesium and iron. Mafic minerals include olivine, pyroxene, amphibole and biotite mica.
Intermediate igneous rocks are moderate amounts of silica (52-63 wt.%) and have nearly equal amounts of felsic and mafic minerals.
Felsic is an igneous rock that is rich in light-colored silicate minerals such as feldspar and quartz (silica).
a type of fracture that has a smoothly curving surface of fine-grained materials. Some say this is shell-like. This forms in material which have no planar surfaces of internal weakness or planes of separation (no cleavage). Such a curving fracture surface is characteristic of glass and other brittle materials with no crystal structure.
A volcano that is potentially active and not erupting now, but that is considered “active” because it could erupt in the future. Mount Hood is currently dormant.
volcanoes that will not erupt again
