
Chapter 7: Weathering and Sedimentary Rocks
Learning Objectives
The goals of this chapter are to:
- Understand types of weathering and their products
- Identify and classify sedimentary rocks
- Interpret depositional environments
7.1 Weathering
Weathering occurs when a rock is exposed to the “weather”, or to the forces and conditions at Earth’s surface. A rock exposed at the surface can experience changes in temperature, oxygen and other gases, and water. Each interacts with rocks to break them down physically and/or chemically. Physical weathering, also called mechanical weathering, is the breakdown of rocks into smaller fragments, called sediment. The mineral chemistry is not altered during physical weathering. Chemical weathering does alter the chemistry of minerals, either by dissolving minerals in a solution of water, or by replacing elements in a mineral. Chemical weathering typically results in ions (elements) remaining dissolved in a solution that can later precipitate to form new minerals or rocks.
Physical and chemical weathering often go hand in hand because physical weathering produces fresh surfaces for chemical processes to attack, and chemical weathering weakens the rock so that it is more susceptible to physical weathering. This creates a feedback loop that keeps the weathering processes active.
Exercise 7.1 – Distinguishing Types of Weathering
A simple analog for weathering is eating a candy bar such as a Snickers or Baby Ruth bar. If you pop it in your mouth and let it “weather”, this is analogous to chemical weathering as the chocolate, nougat, and caramel will dissolve and be transformed by your stomach. If you then crunch on the remaining peanuts, they are broken into smaller pieces similar to physical weathering. You can also perform a similar experiment on a frozen candy bar and at higher temperatures if you leave the candy bar in your car on a hot day. How will these conditions change the types and rates of weathering?
Another control on chemical weathering is the type of minerals present as they react differently with water. In this thought experiment about weathering a candy bar, which ingredient will dissolve first? and last? Similarly in a rock, some minerals are easy to dissolve including calcite and olivine and the most difficult is quartz with other minerals falling between these end-members.
Observe the different types of weathering in Figures 7.1-7.4. Then, answer the questions below.
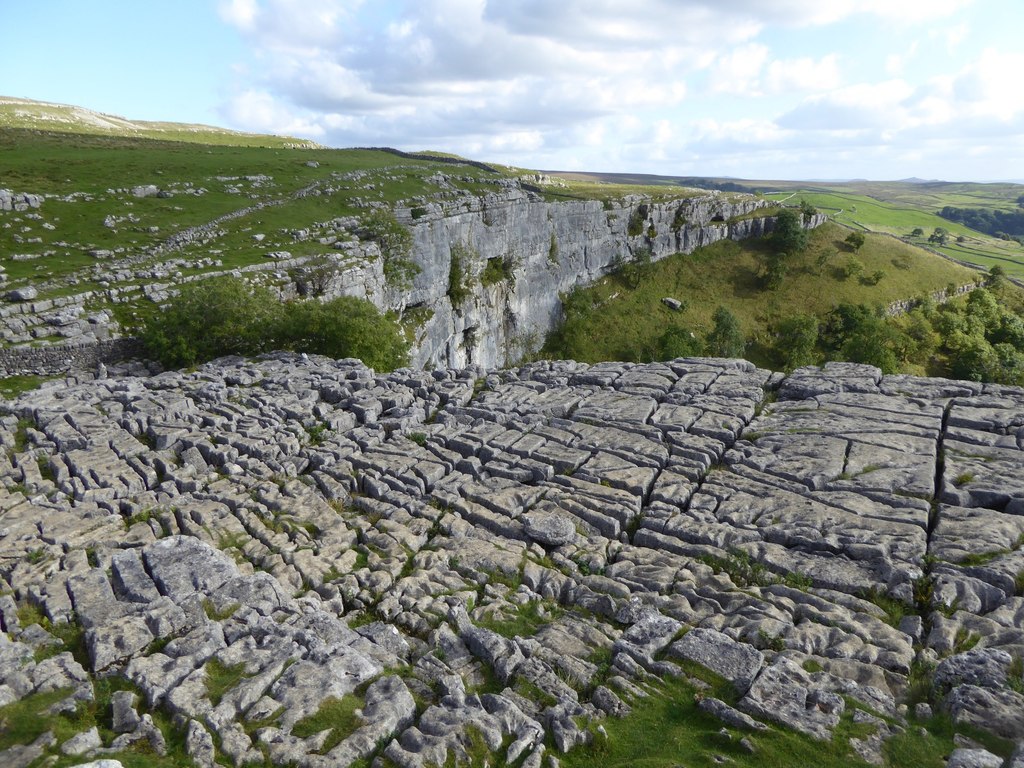
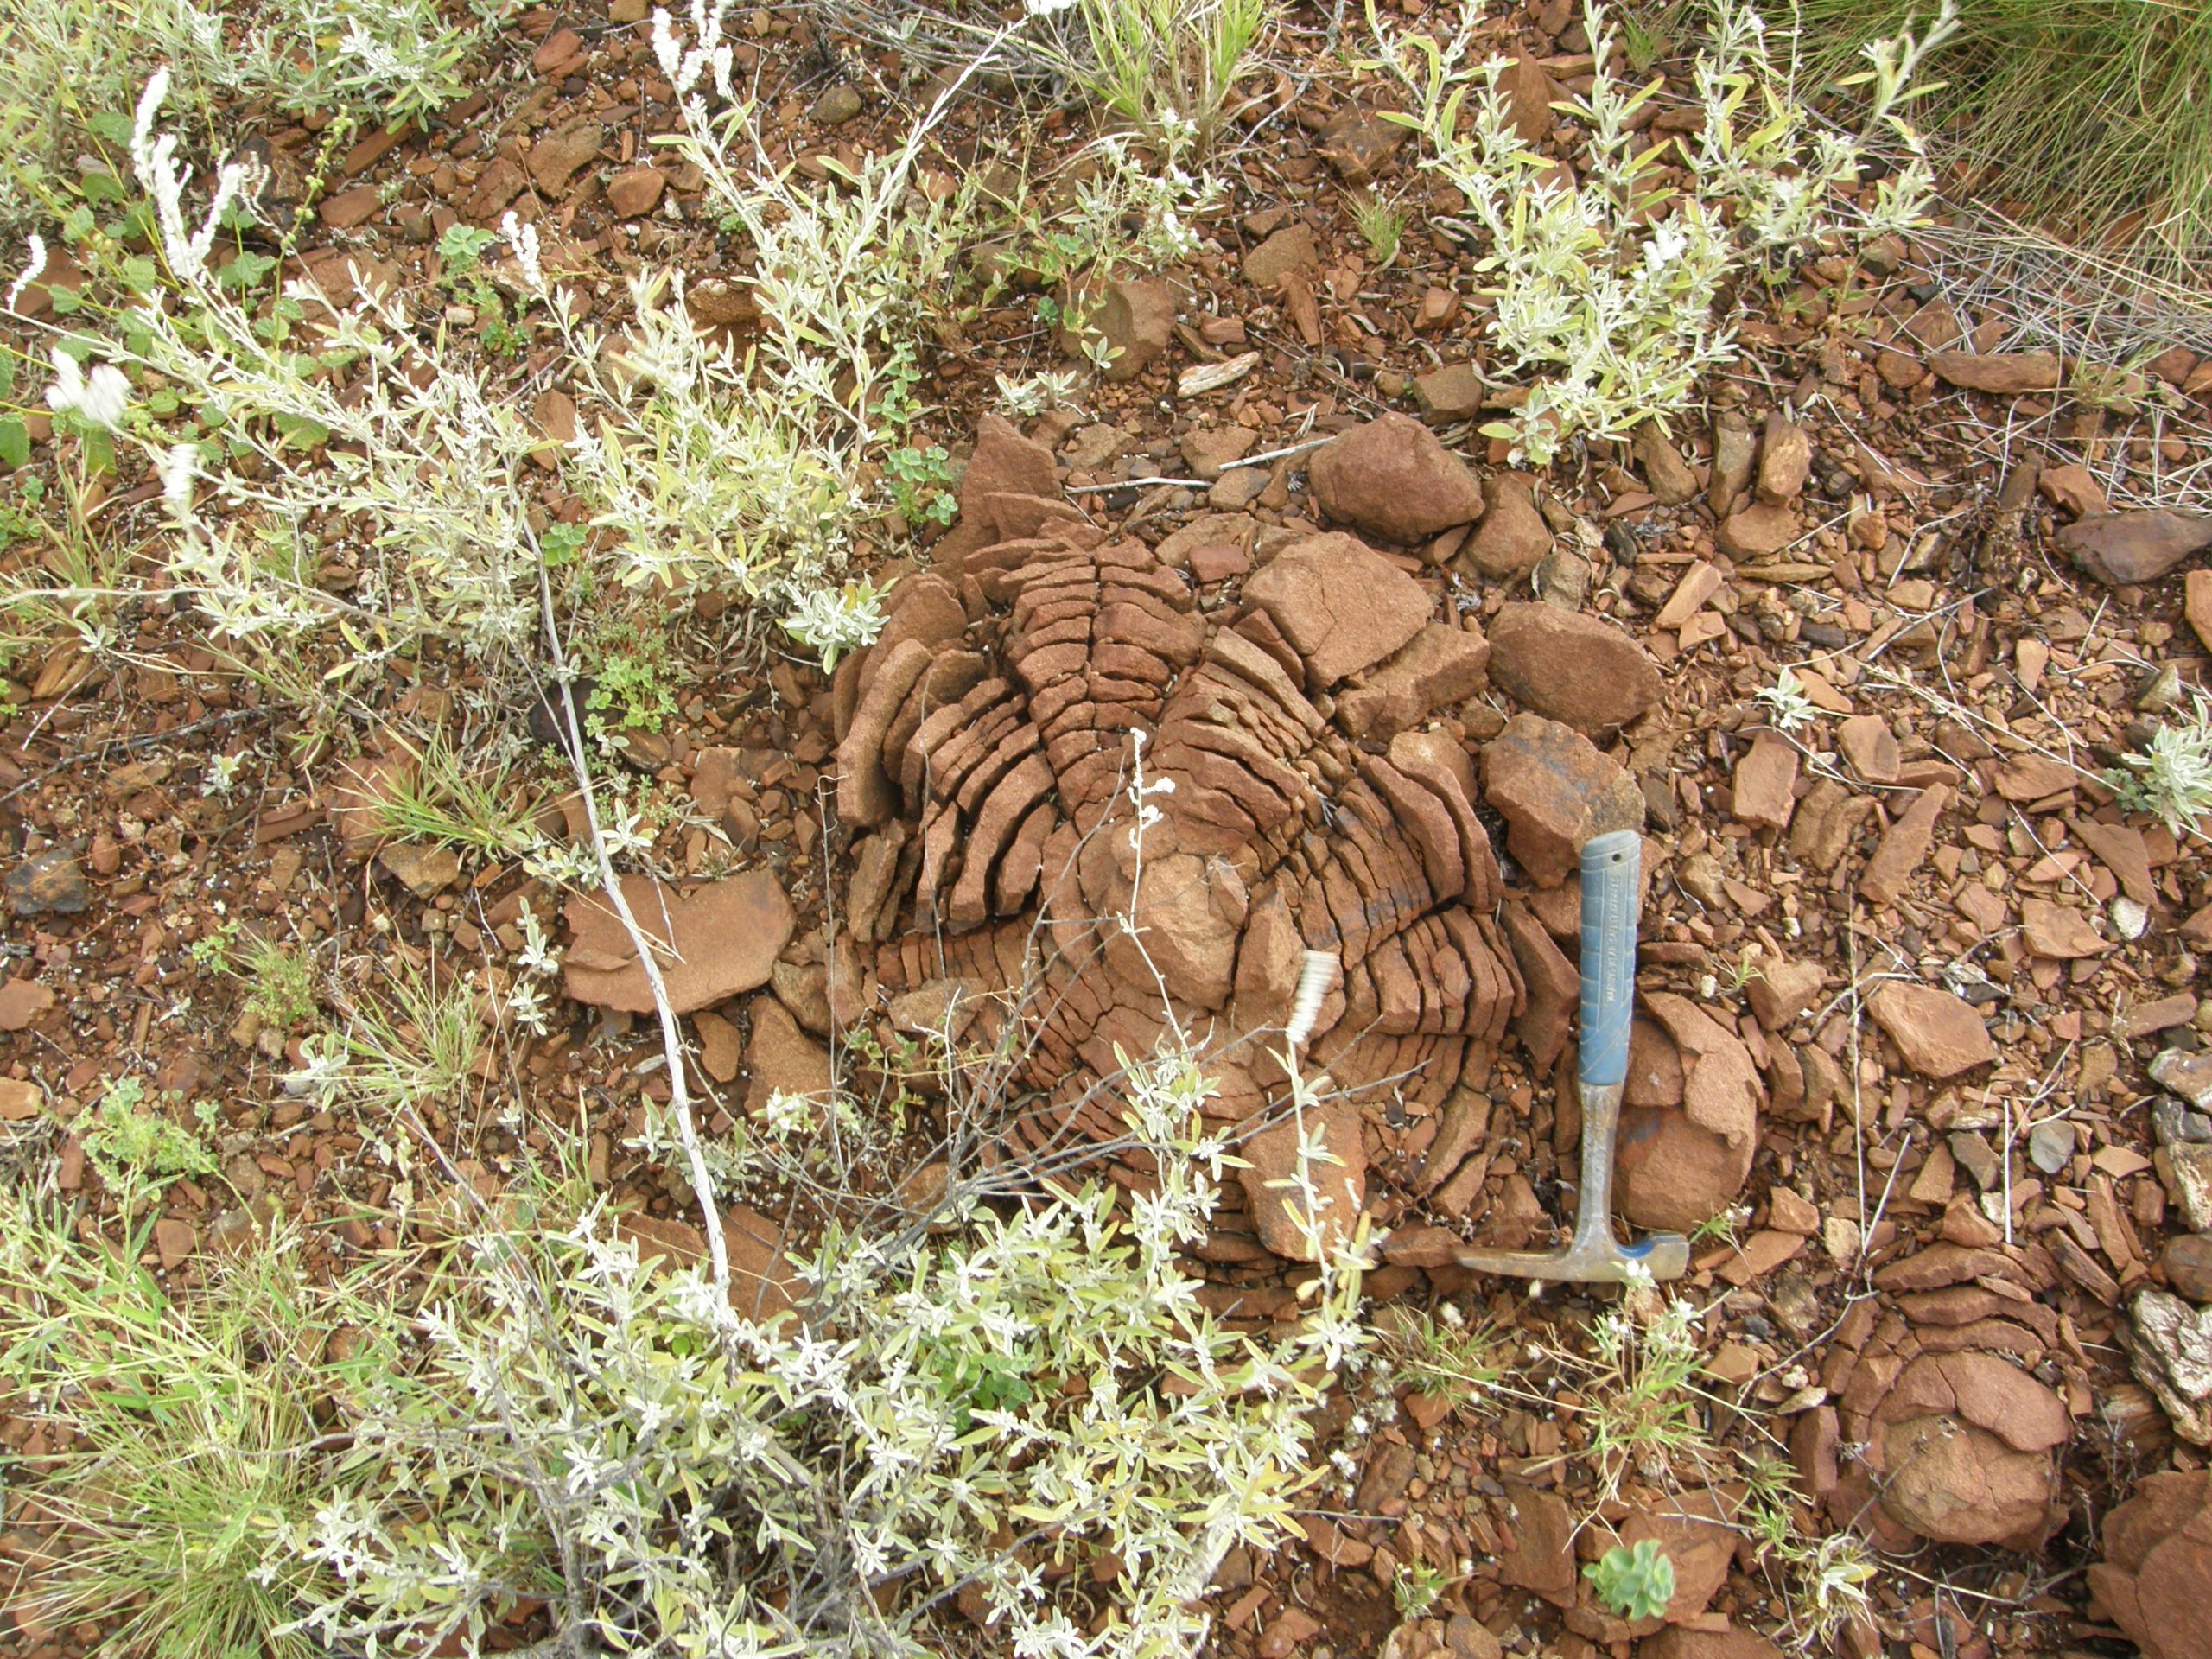

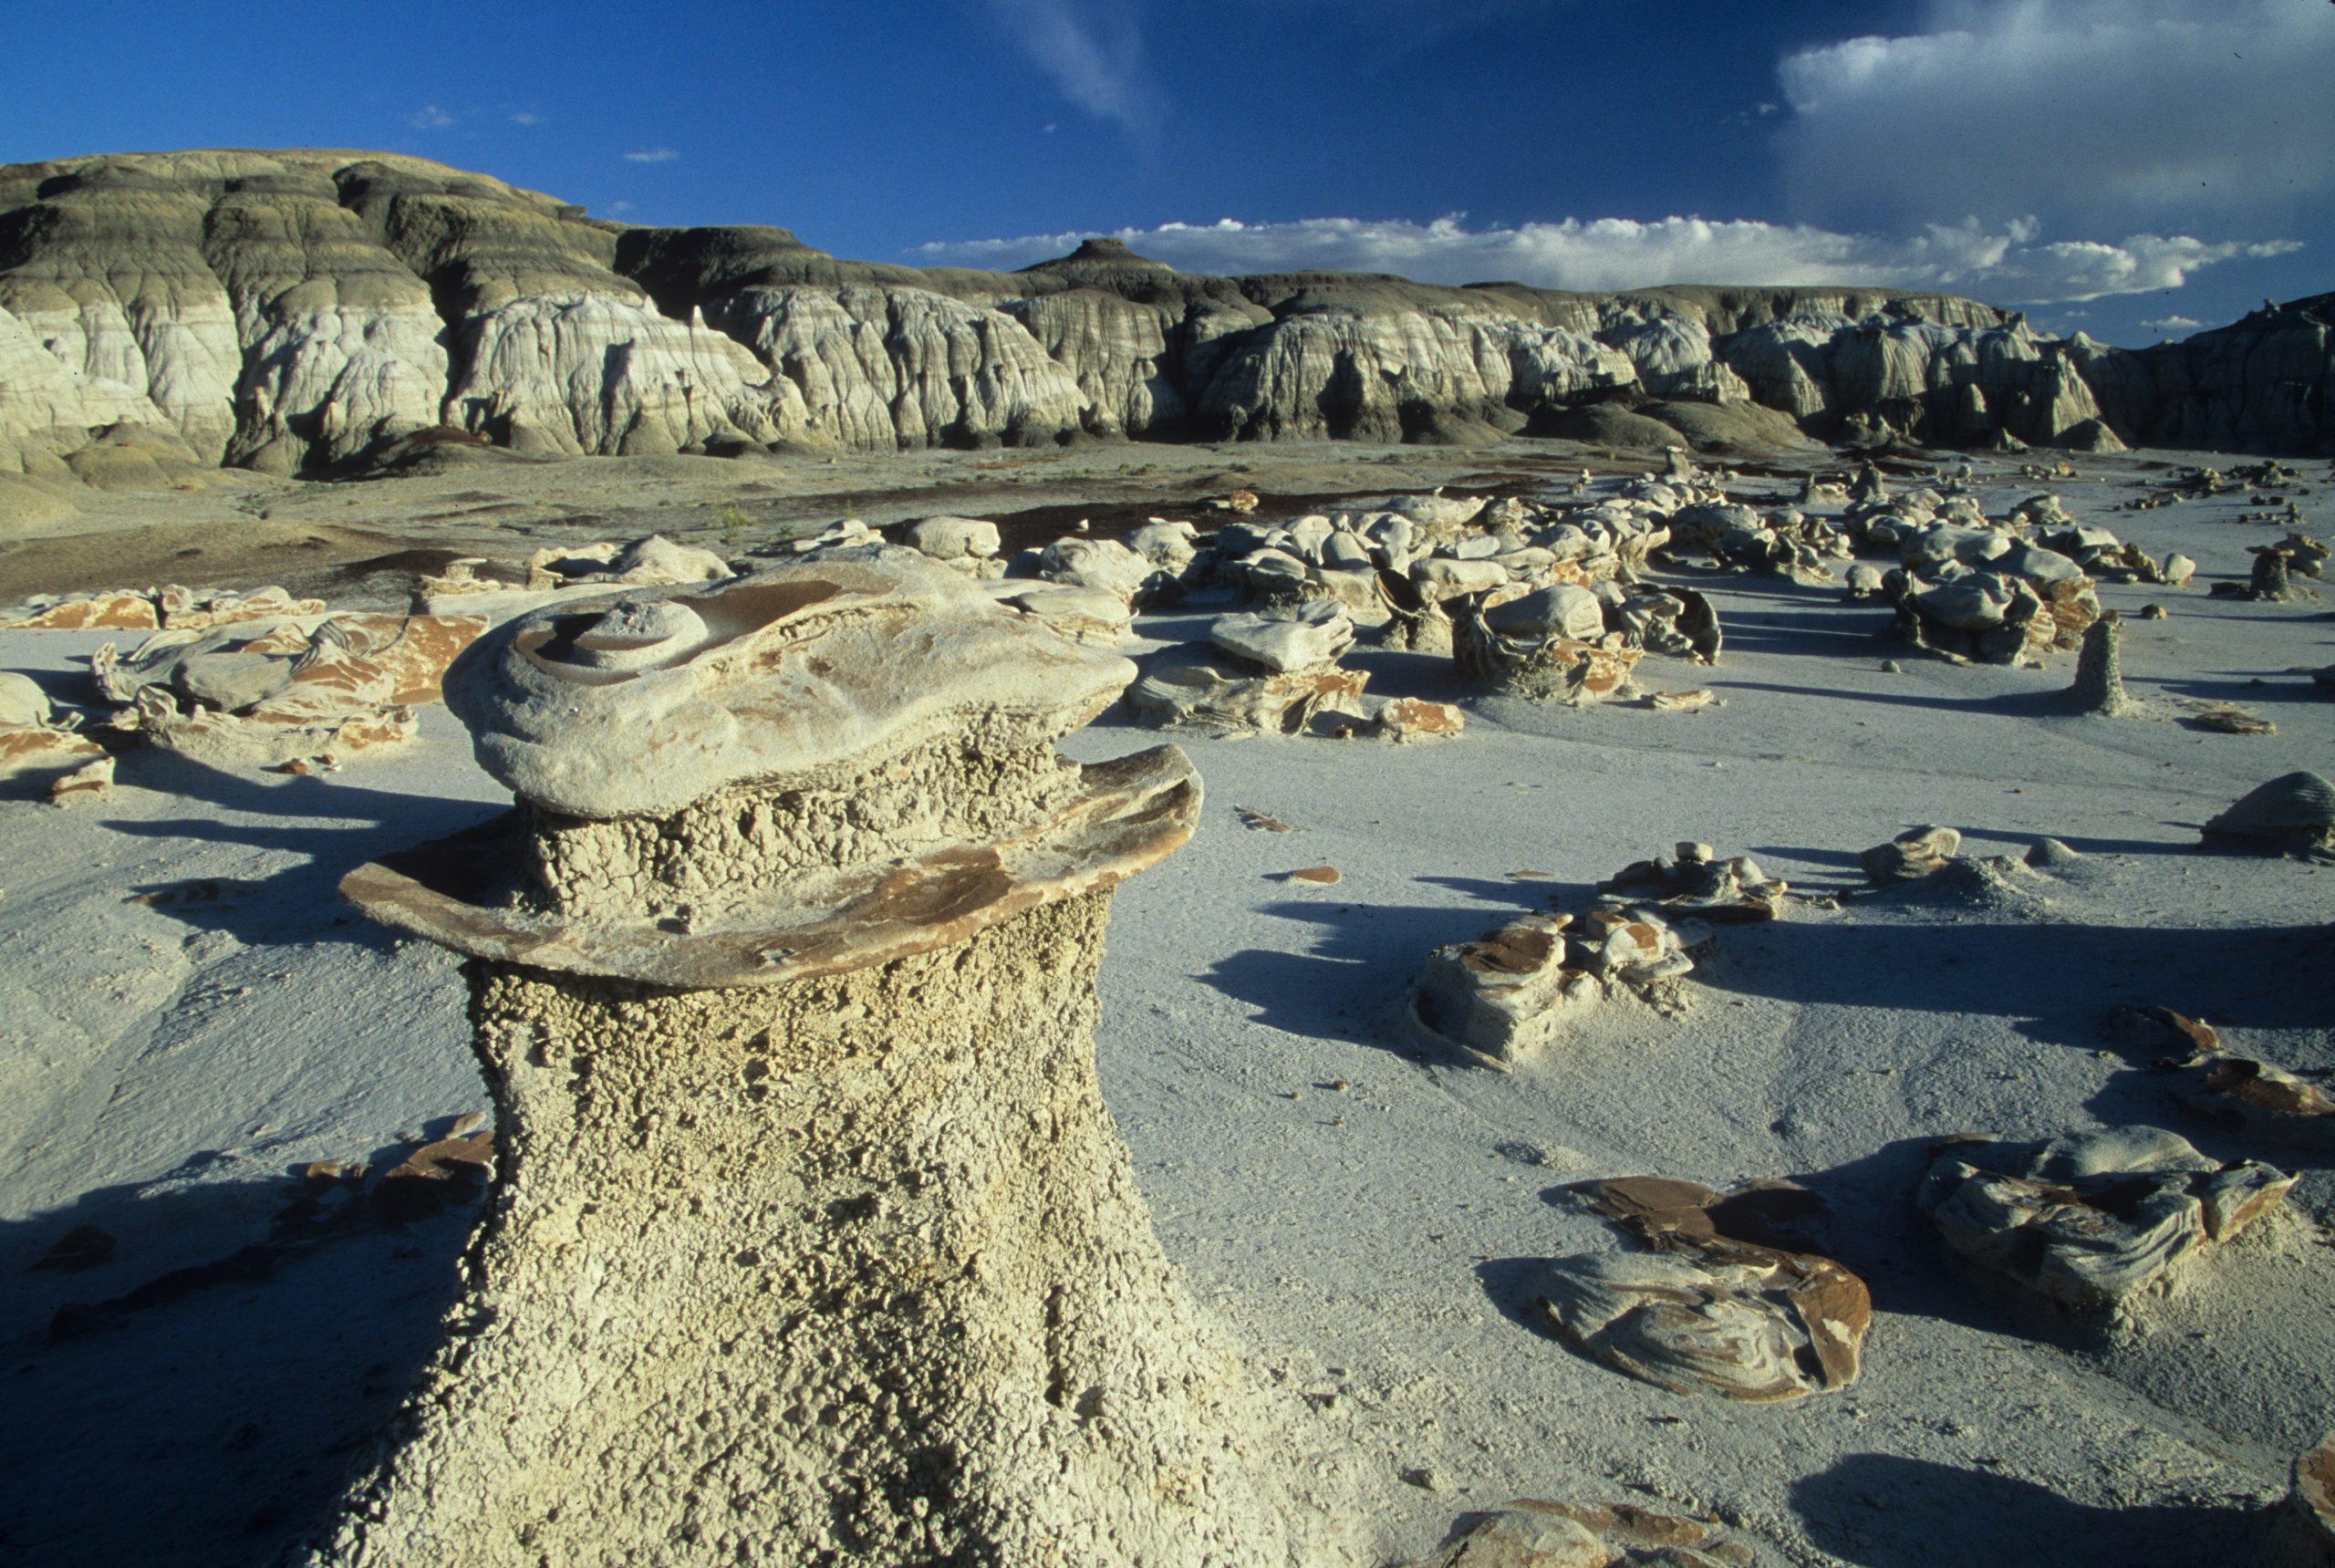
- For each image, describe the important features that you see.
Table 7.1 – Weathering features Image Your observations Malham Cove England Pilbara Australia Shilin China Bisti/Da-Na-Zin NM - What do you notice about the landscape in each image? Think about where this is located and use terms such as dry (arid), lush green, rolling hills, mountainous, etc.
Table 7.2 – Landscape features Image Your observations Malham Cove England Pilbara Australia Shilin China Bisti/Da-Na-Zin NM
- Use your observations about the rock features, rock type, and landscape to interpret whether chemical or physical weathering is the dominant process. Or if both processes are present? Explain your answer.
Table 7.3 – Interpretation of weathering Image Chemical, physical or both Malham Cove England Pilbara Australia Shilin China Bisti/Da-Na-Zin NM - Critical thinking: Do you know of any features near you that either formed from chemical or physical weathering? Either give a location, submit a picture, or describe this feature Why you think it is chemically or physically weathered?
Sediment is an important ingredient of soil (dirt) which is the Earth’s life support system. Soil is ~45% sediment and ~50% air and water depending on the local climate. Another small but vital component of soil is organic matter including humus (peat), roots, and organisms such as bacteria, worms and insects. Soils around the world vary in color, texture, structure, and chemical, physical, and biological composition. In addition to the soil you see at the surface, soils are often classified in vertical profiles that reflect both regional climate and the type of rock underneath.
Exercise 7.2 – Classifying Soils
Soil color is the easiest property you can observe. While color itself does not reflect the practical use of soils, it does indicate important information about the soil organic matter content, mineralogy, moisture, and drainage. You may observe a wide range of colors including brown, red, yellow, black, gray, white, and even blue or green. Soil color can vary dramatically across landscapes, between the horizons of a soil profile, and even within a single sample. These colors results from chemical and biological weathering, especially redox reactions.
Either bring a sample of soil (dirt) to lab or go collect one during the first few minutes of lab. Most geoscientists will record the location of their sample in either degrees, minutes seconds or decimal degrees. You don’t need to do this for this exercise.
- What did you do to be sure you had a good sample?
- Soil scientists use the Munsell color system (Figure 7.5) that specifies colors based on three properties: hue (basic color), value (lightness), and chroma (color intensity). Use this to classify your soil color. Be sure to record all three properties. Your instructor will provide you with handouts from the Munsell soil color chart appropriate for soils in your area.
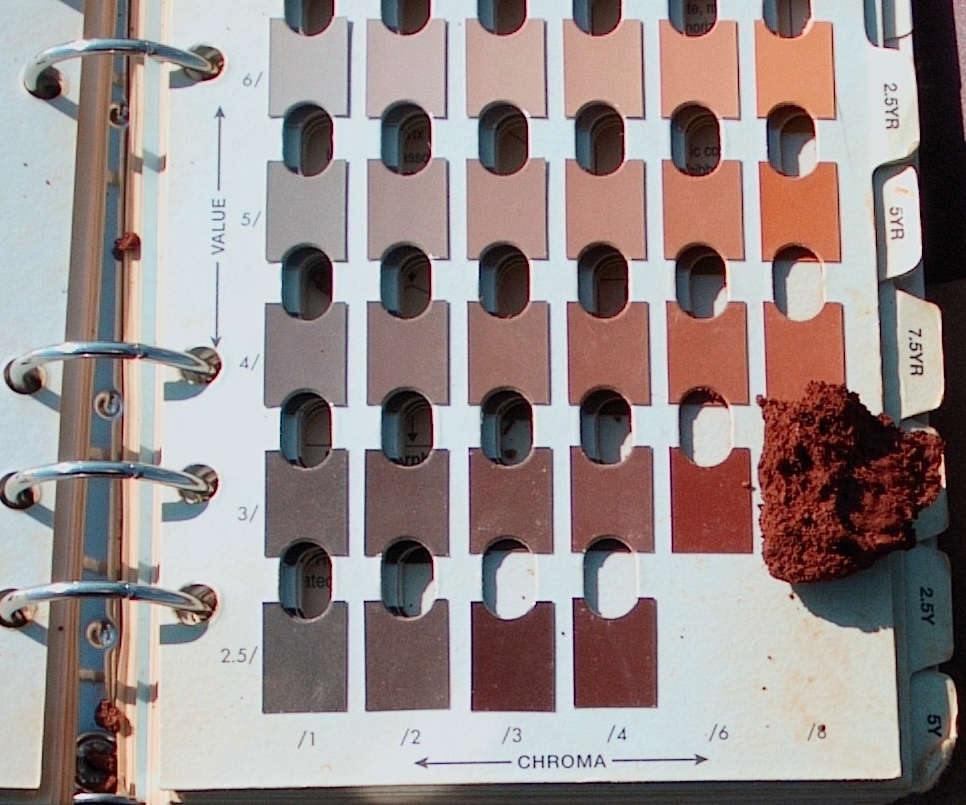
Figure 7.5 – Use the Munsell color scheme to identify your soil color. This soil sample is classified as 2.5YR/3/6. Image credit: John Kelley, CC BY. Soil texture reflects the grain size of the different components of soil which include clay, silt, and sand. For analyzing soils and sediment, clay is not a mineral but a grain size <0.004 mm. Sand is classified as grains between 0.06 to 2 mm. In between these is silt (0.004 to 0.06 mm). Are you thinking, how can I measure grains that are this small. You will use the “feel method” to determine the sand/silt/clay percentages of your sample (Figure 7.6). If necessary, wet the sample slightly, and then rub it between your thumb and index finger. It is now possible to feel how much sand, silt, and clay are in the sample. Sand will feel gritty and won’t stick together, silt will feel very smooth, floury or powdery, and clay will feel sticky or slick and can be rolled very thin sheets.
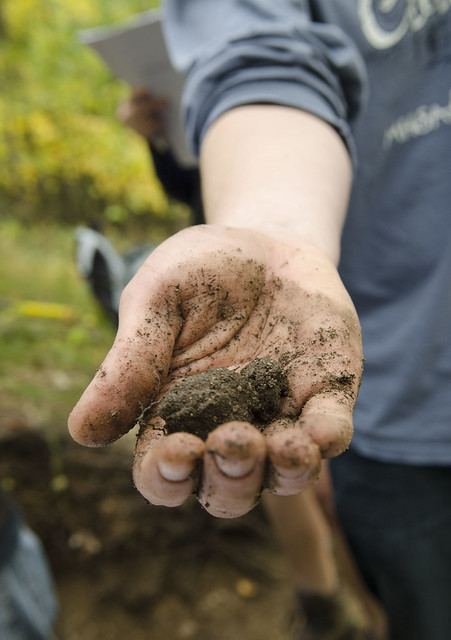
Figure 7.6 – A student uses the feel method to determine soil texture. Notice the visible sands grains and how the sample sticks together because of a high clay content. Image credit: Dave Brenner CC BY. - What are the percentages of clay, silt and sand in your soil? These values should add up to 100%.
- Critical thinking: How variable are the different samples used by your class? Can you explain the similarities and differences?
The weathering rate of rocks and minerals is affected by the composition of the atmosphere (acidity), temperature and rainfall rates, even at a local level. Some other factors are the amount of exposed surface area as a bigger surface area can increase exposure to weathering agents as well as the slope of a hillside may affect erosion rates and the direction of the hillside relative to north. Why may this be of interest? Here are two possible reasons. 1) If you are interested in cultural heritage sites, it is important to assess these rates to help you preserve these. 2) Or perhaps you want to know the effects of industrial pollutants such as dissolved CO2, SO2, SO3, and Cl which are known to cause corrosion.
Exercise 7.3 – Weathering Rates
Some consider gravestones to be a perfect way to test weathering rates as most are the same size, are vertical, and oriented in the same direction within a cemetery. Depending on the available rock quarries in an area, they will probably also be the same rock type. Many areas also have weather stations that record temperature and rainfall. So, armed with simple tools, you can estimate weathering rates using gravestones.
Using calipers that you can buy at hardware stores, you can measure the weathering of marble gravestones by measuring the thickness of the gravestone, at the top, along the side, and at the bottom. If the gravestone originally had a uniform thickness, you could see changes in thickness due to weathering over time. Another way is to compare the depth of inscriptions on the gravestone. Others use ultrasonic testers called Schmidt hammers.
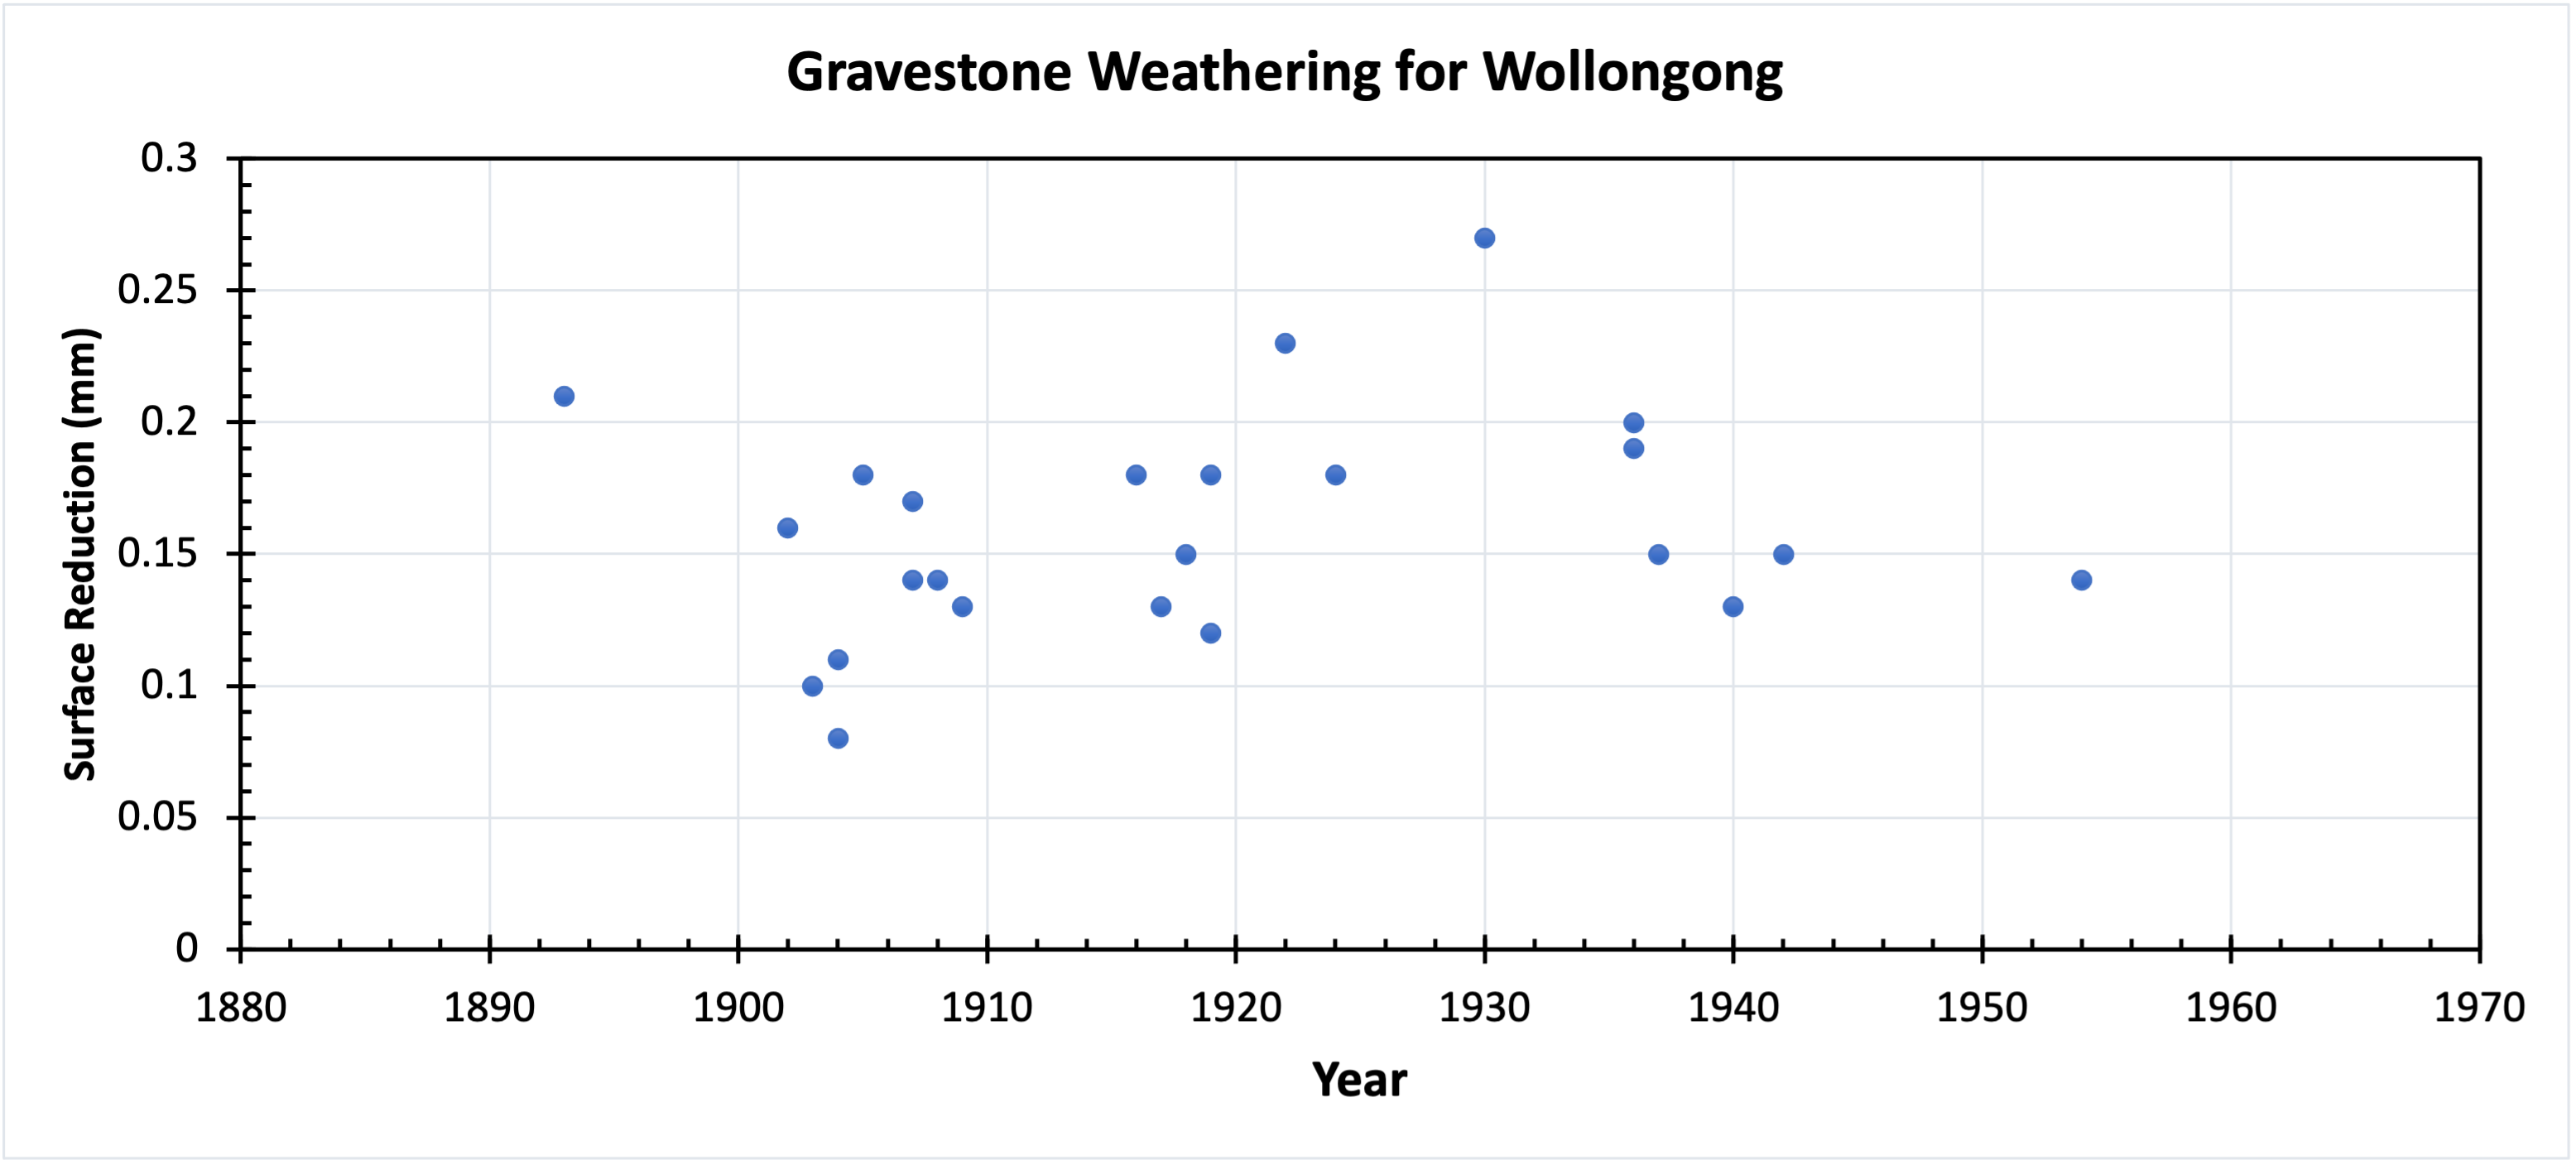
Below are the results of a study of marble gravestones in Australia (Figures 7.7 and 7.8). The data is from two areas: an urban residential area in Sydney and an industrial area in Wollongong (65 km or 45 miles south of Sydney). The year is when the gravestones were inscribed. The surface reduction is a measurement of how much weathering has occurred on the gravestones’ surface since they were emplaced.
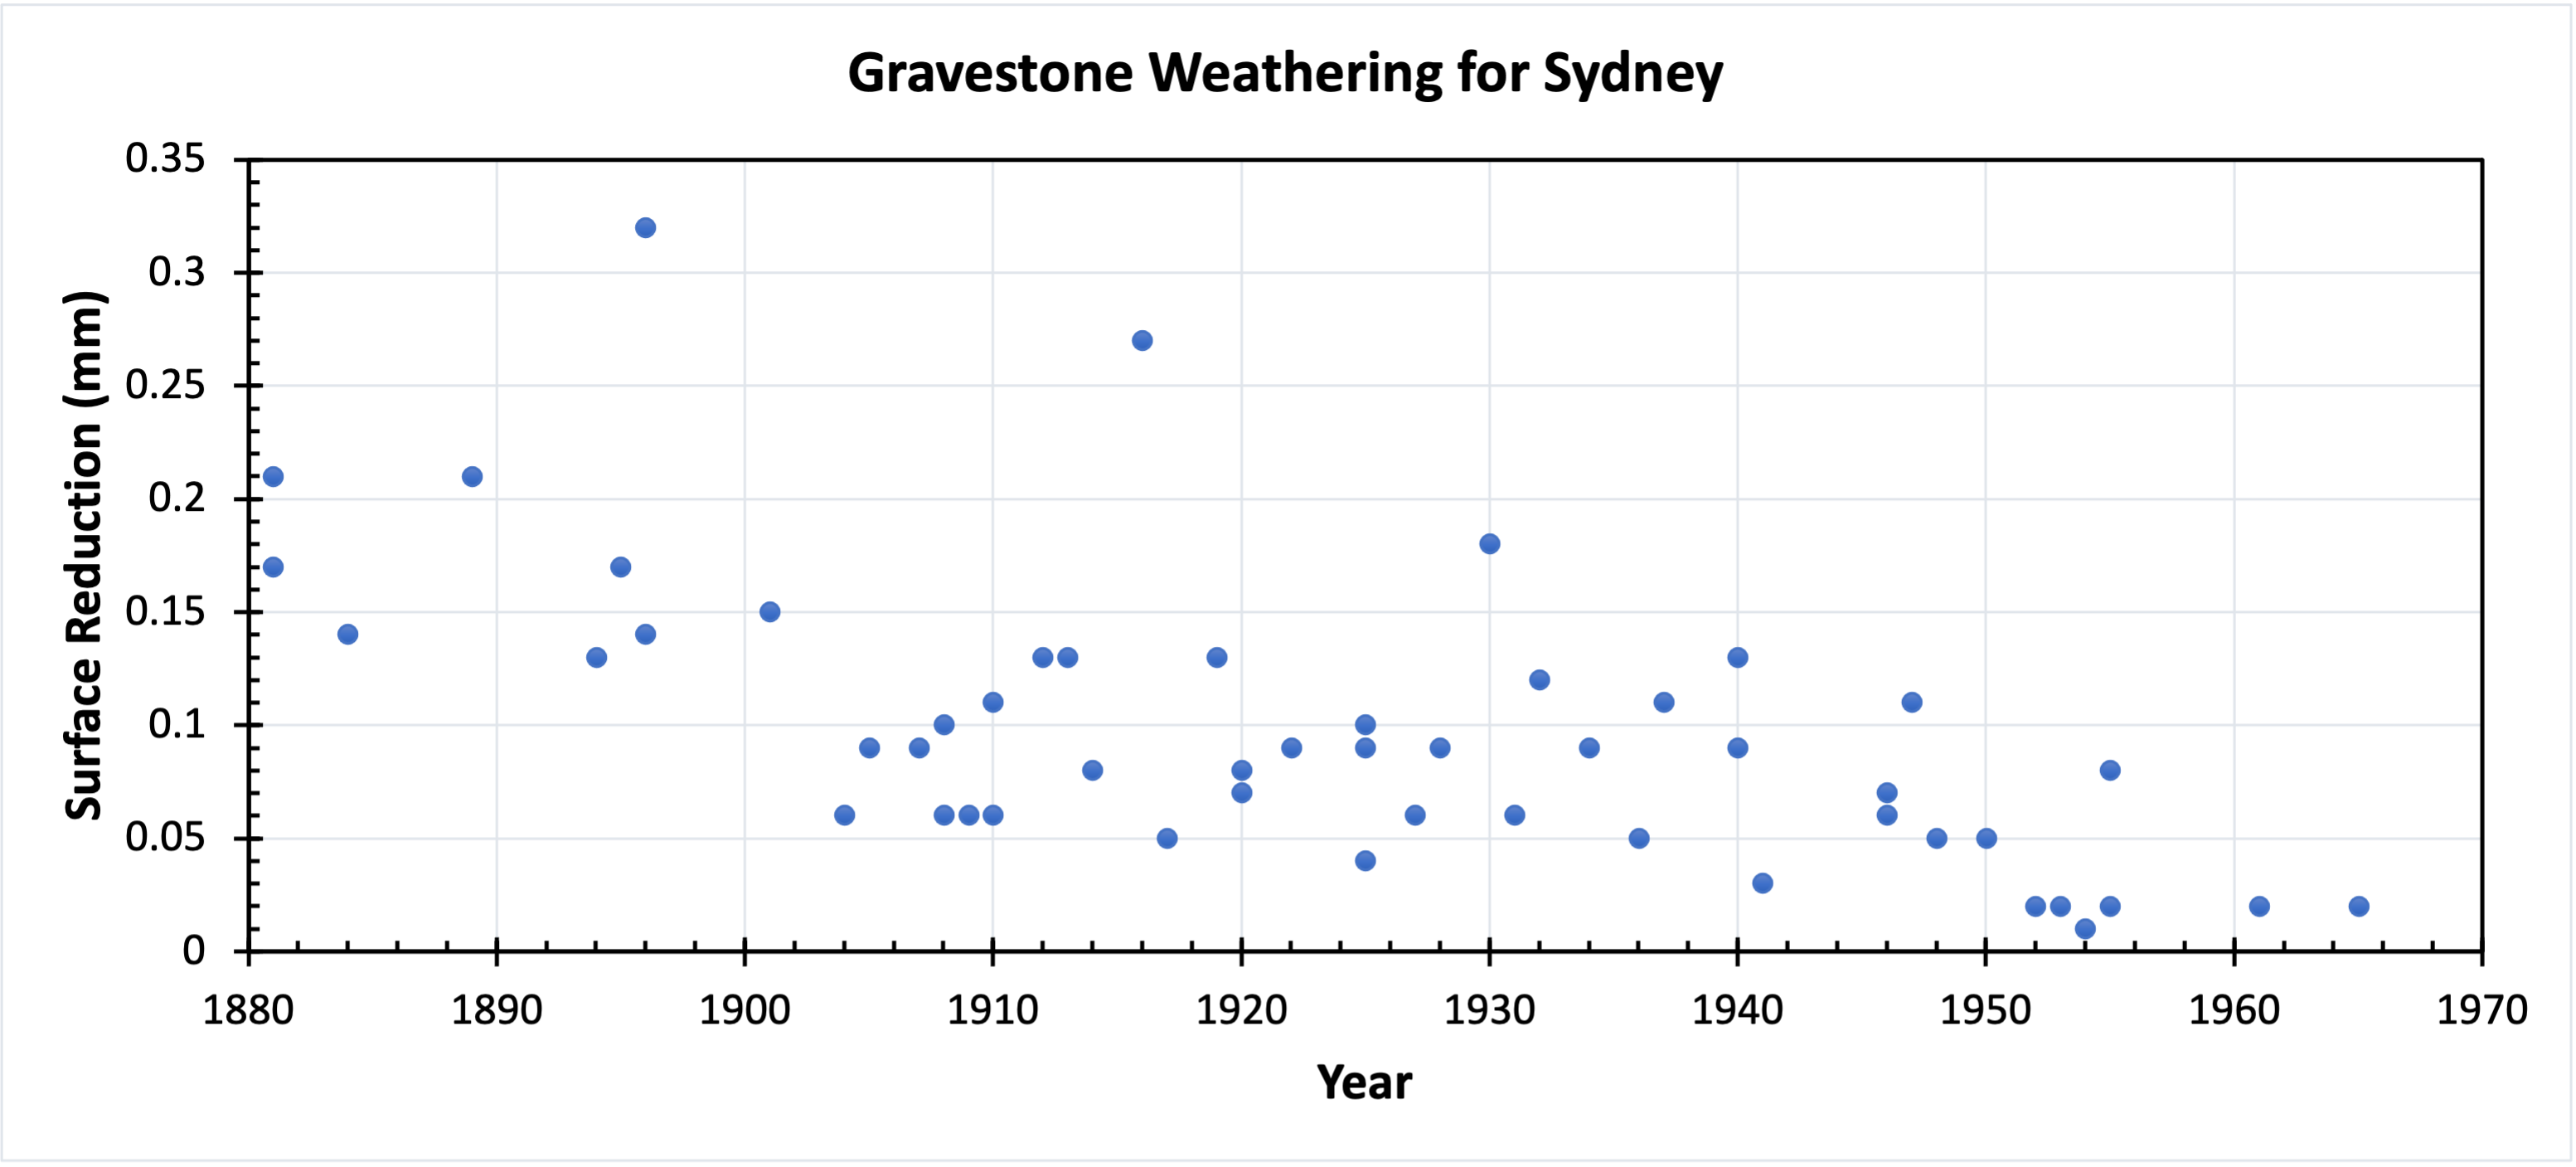
- Describe the relationship between weathering and age of the gravestones in Sydney.
- What is the relationship between weathering and age of the gravestones in Wollongong? How does it compare to Sydney?
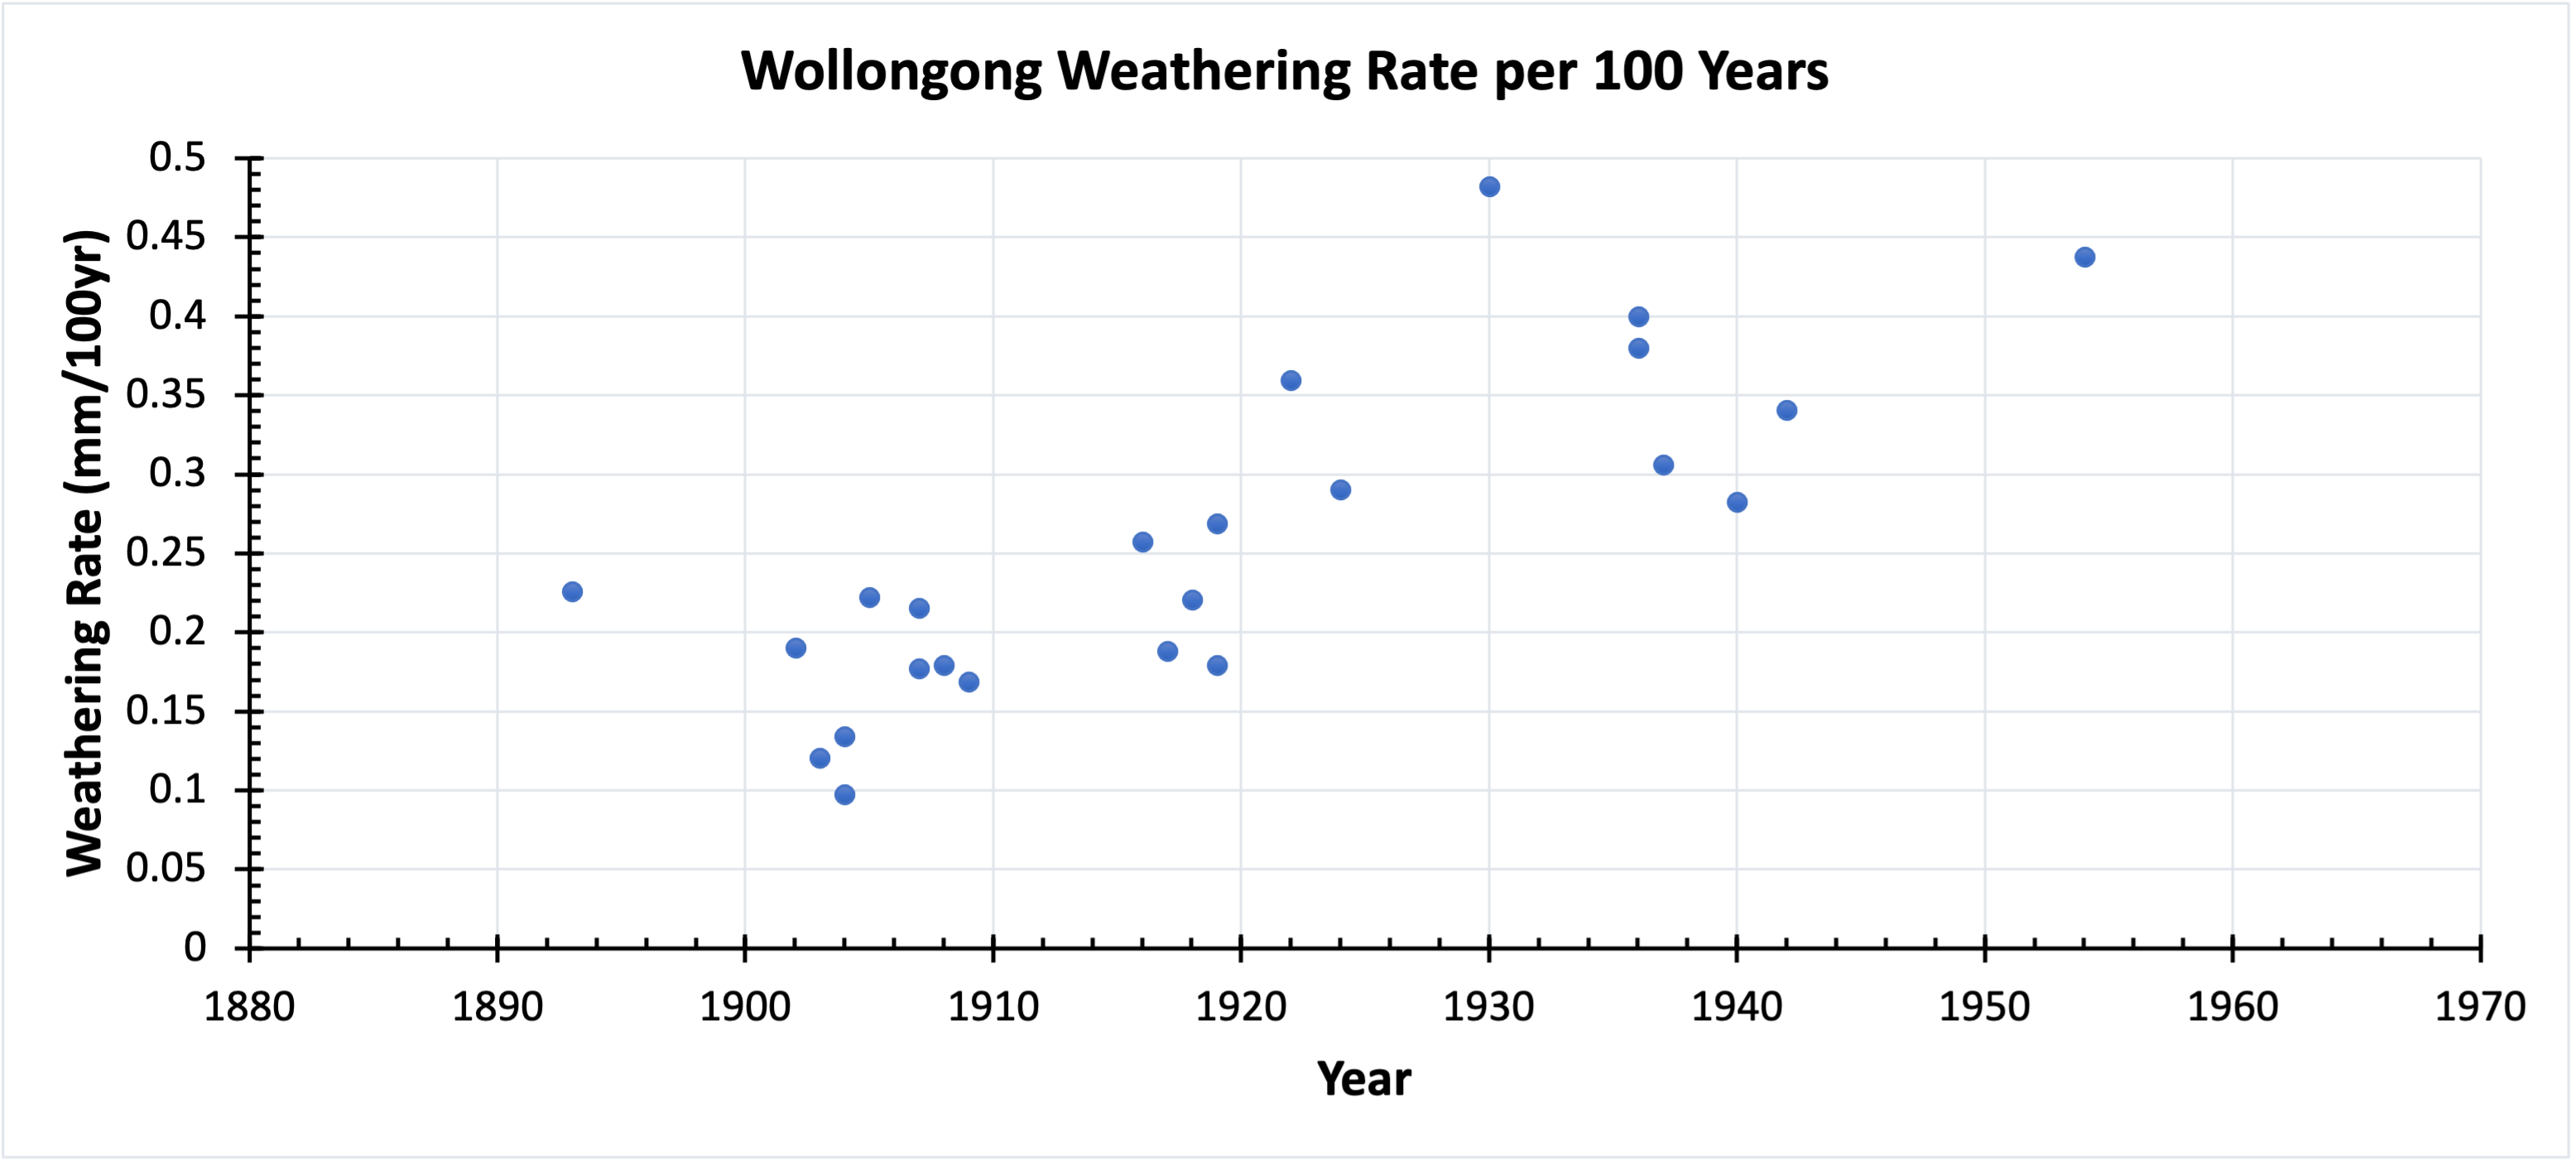
Another way to look at this data is to analyze the weathering rate per 100 years (Figures 7.9 and 7.10), but we don’t have 100 years’ worth of data for each gravestone. So, we extrapolate the available weathering data to 100 years, assuming a consistent weathering rate for each gravestone. For example, the gravestone in Wollongong that was emplaced in 1940 would only be a 46-year record (measurements were taken in 1986). In that 46-year period, the gravestone weathered a total of 0.13 mm, or about 0.0028 mm/year. Multiply the yearly weathering rate by 100 and you get a weathering rate of 0.28 mm/100 years.
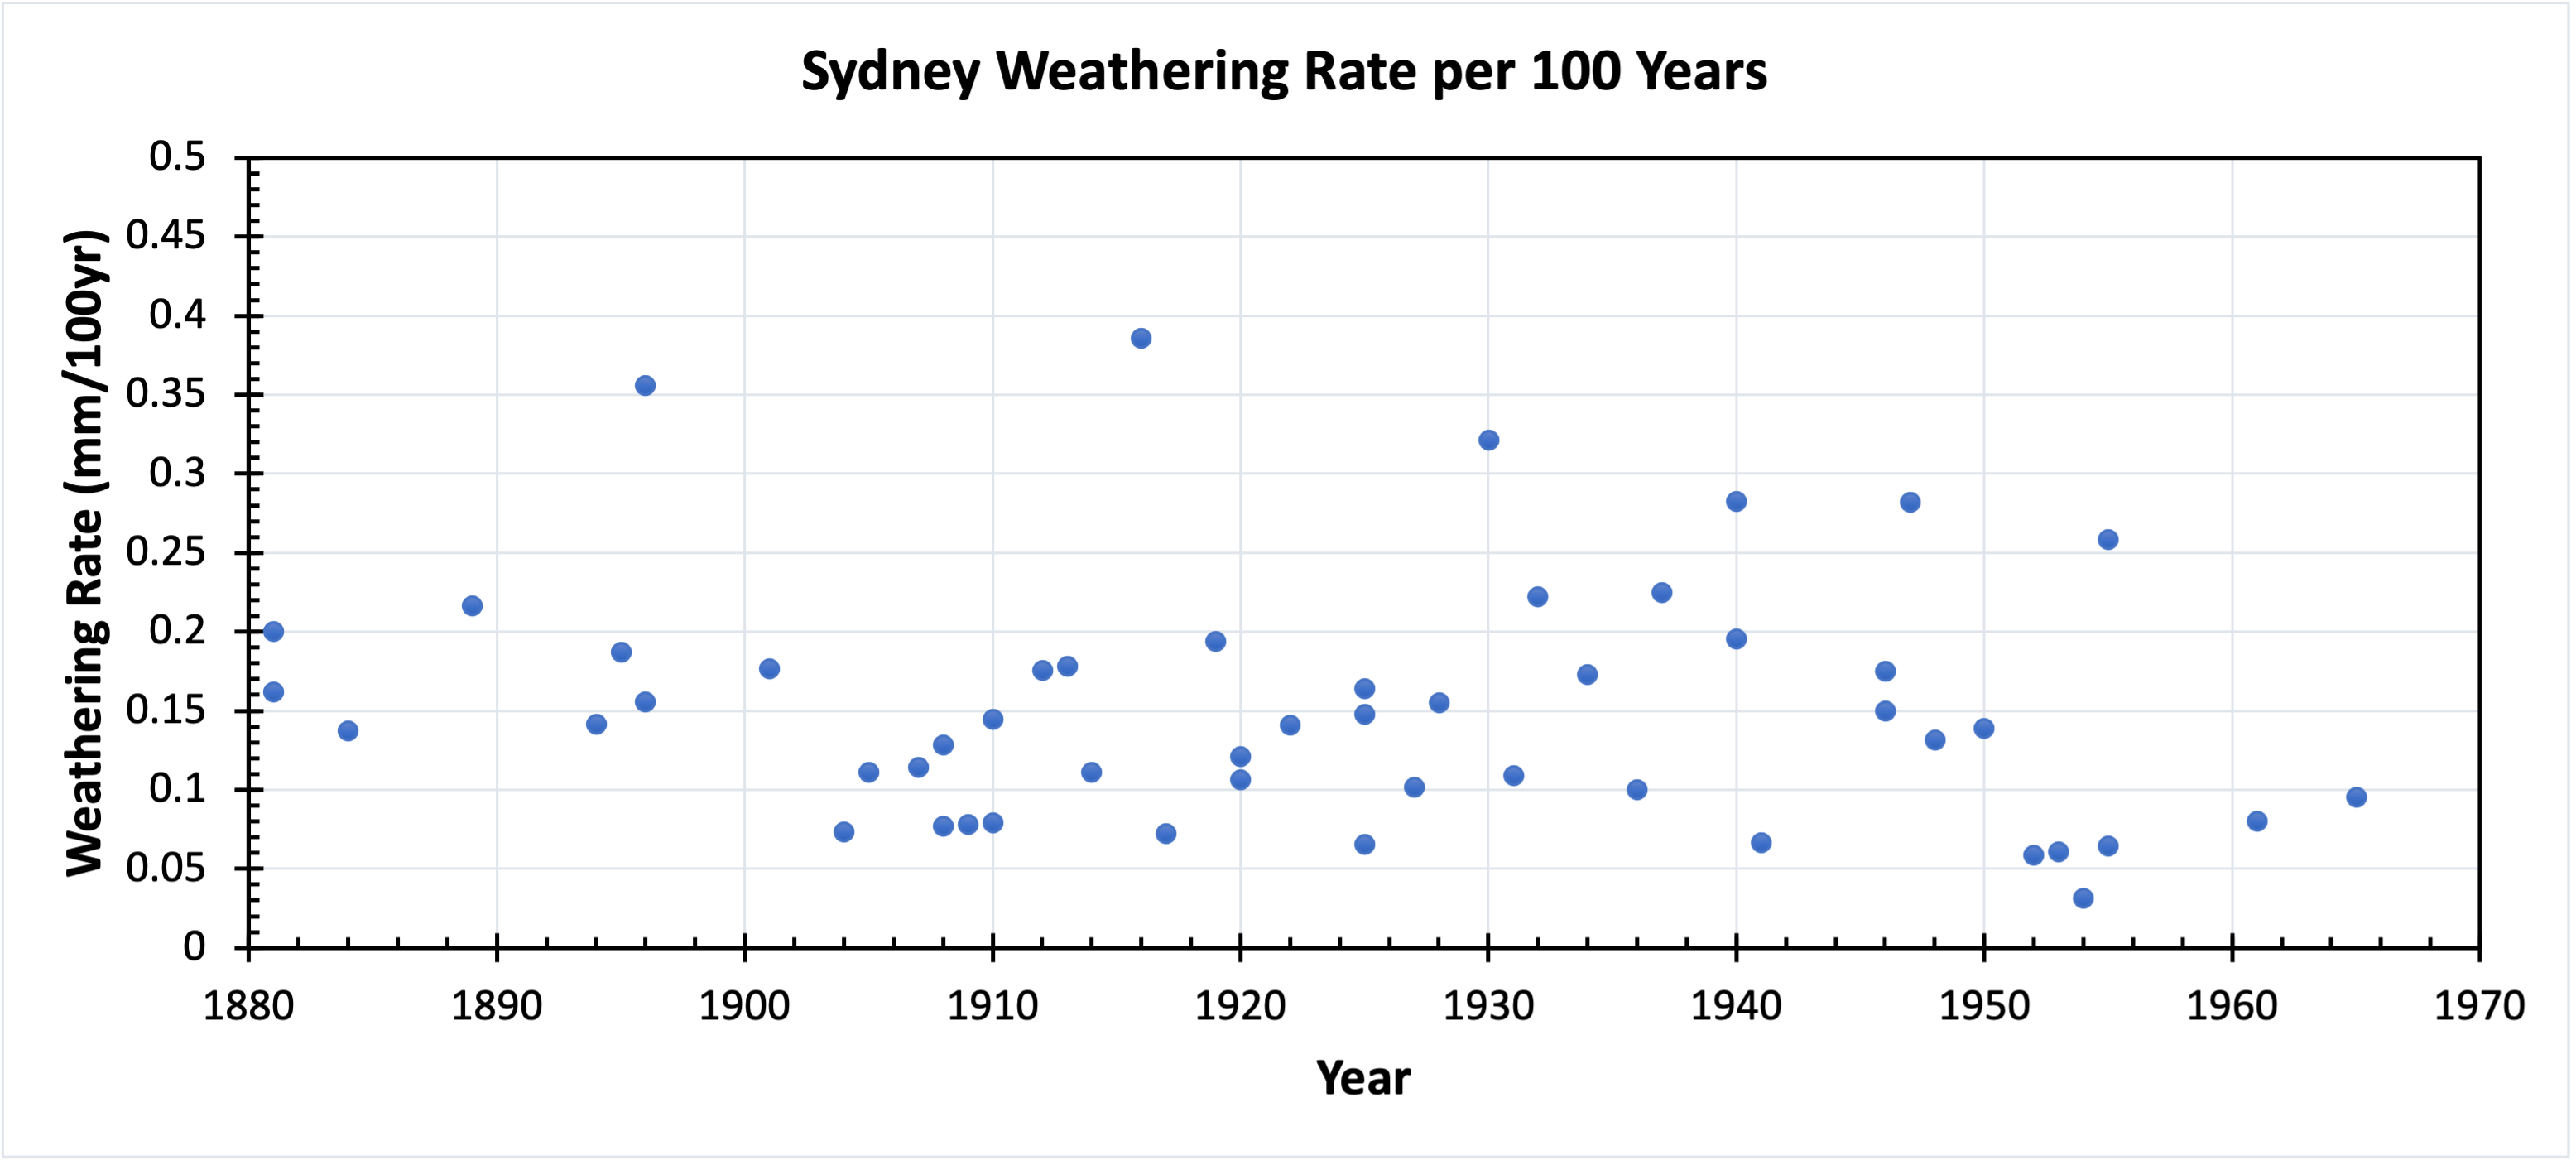
- What is the average weathering rate per 100 years for Sydney? Draw a line of best fit on Figure 7.9. ____________________
- Has the rate of weathering changed for Sydney? If so, can you locate when the change occurred?
- What is the average weathering rate per 100 years for Wollongong? Draw a line of best fit on Figure 7.10. ____________________
- Has the rate of weathering changed for Wollongong? If so, can you locate when the change occurred?
- On average, gravestones are about 4 inches thick (102 mm). Using the weathering rate for the 1940 gravestone in Wollongong of 0.28 mm/100 years (0.0028 mm/year), how many years would it take for this gravestone to completely weather away? ____________________
- Critical thinking: Compare the weathering rate over time for both sites. Which are the principal factors controlling weathering rate between the two sites? Do you think this similarity or difference will continue in the future?
This exercise is adapted from G.S. Hancock and C.M. Bailey.
7.2 Sediment Erosion, Transport, Deposition, and Lithification
What happens after weathering? The particles need to be moved or eroded. Sediment particles that were physically weathered are moved by water, wind, and ice. When the water or wind slows down, or when the ice melts, the sediment stops moving and is deposited. These mechanisms can transport sediment hundreds of kilometers. For ions that were chemically weathered, they can precipitate out of the solution under certain conditions, forming solid particles that can be deposited.
In all cases, sediments need to undergo lithification to transform from loose grains to a solid rock. Typically, two steps are involved in turning sediment into a sedimentary rock; compaction and cementation. When grains are deposited, they typically have empty spaces between them called pores (porosity). Compaction reduces porosity by bringing the grains closer together. The best analogy to think about is your garbage can at home. When the garbage can is full, do you change the bag right away or do you push down on it to create more room? By pushing down on the trash, you reduce the space between the pieces of garbage and create more room at the top; this is compaction. Sediments work the same way, but what’s causing the compaction is the accumulation of more sediment on top of the previously deposited material. The more sediment piled on top, the more compact the sediment beneath it becomes.
Cementation is a process that happens during either at the surface or during compaction. As sediments interact with water, minerals precipitate in pore space acting as a glue that holds the sediment together. During compaction, water is squeezed out of the pore spaces; this enhances cementation. The common minerals that make up cement are calcite, quartz, and pyrite.
Exercise 7.4 – Observing Sedimentary Rocks
Your instructor has provided you with a set of rocks. Continuing with our ideas of classification, sort these rocks into groups based on any criteria you want to use. Your instructor may ask you to re-classify the materials several times using different criteria.
- Which criteria did you use? Why?
b. Did you need to reclassify your samples? If so, which criteria changed?
7.3 Sedimentary Rock Classification
Sedimentary rocks are classified as clastic, chemical, biochemical, and organic based on how they form:
- Clastic sedimentary rocks form when other rocks weather into small particles and are transported by wind, water, or ice to an area where they are deposited. They form a clastic sedimentary rock after undergoing lithification.
- Chemical sedimentary rocks form when sediment precipitates out of solution, most commonly water. For example, if you have a body of water containing dissolved salt and that water evaporates, it will leave behind the salt as a solid mineral form called a precipitate, which is a chemical sedimentary rock. Biochemical sedimentary rocks form in a similar manner, except that biological processes cause the precipitation of the material. For example, foraminifera are tiny, single-celled organisms that precipitate shells made of calcium carbonate. After they die and decay, their shells may sink to the bottom of the ocean and accumulate to form a sedimentary rock. In this case, biological processes caused the chemical precipitation of the mineral for the shell, but it doesn’t contain organic compounds, so we call it biochemical. For the purposes of this lab, we’ll consider chemical and biochemical rocks together.
- Organic sedimentary rocks form from the accumulation of organic debris. This organic material would need to be buried very quickly, so it doesn’t decay. Organic material in sedimentary rocks is where coal, oil, and natural gas come from.
Exercise 7.5 – Classifying Sedimentary Rocks
Your instructor has given you a set of unknown sedimentary rocks. Identify the rock type of each of your unknown sedimentary rocks.
| Type | Rock Sample Numbers |
| Clastic | |
| Chemical or Biochemical | |
| Organic |
The size and shape of grains within clastic sedimentary rocks can help you interpret that sediment’s history (Figure 7.11). These grains are typically quartz and clay minerals but can sometimes include other minerals or rock fragments. When all the grains in the rock are about the same size, it is called well-sorted. Usually, sediment needs to travel a far distance from its source to be well-sorted. In contrast, poorly sorted sediment is deposited very close to its source. The rounding of sediment grains is also an indicator of how far the sediment traveled. Grains that have smooth edges are considered well-rounded and have traveled a far distance. These grains start out with rough edges and become smoother as they travel further and further. In contrast, grains with sharp edges are considered angular and have not traveled a far distance.

Exercise 7.6 – Clastic Sedimentary Rocks
For your clastic sedimentary rocks, identify the grain characteristics, including the grain size, rounding, and sorting in Tables 7.5-7.7. Use Figure 7.11 to help or a grain size card if your class has them.
| Grain Size | Rock Sample Numbers |
| Fine (silt/clay) | |
| Medium (sand) | |
| Coarse (gravel) |
| Rounding | Rock Sample Numbers |
| Angular | |
| Sub-rounded | |
| Rounded |
| Sorting | Rock Sample Numbers |
| Well-sorted | |
| Poorly-sorted |
Chemical and biochemical sedimentary rocks do not contain clasts of pre-existing rocks. Instead, their minerals either precipitate out of solution or from the growth of living organisms. The most common minerals calcite (or some other form of carbonate) or quartz. Other possible minerals that precipitate from solution include salts and sulfate minerals such as gypsum. Biochemical, or organic, sedimentary rocks are composed of the remains of once-living organisms. They can form from the hard shells of animals and microorganisms or incorporate significant quantities of decaying organic matter into the structure.
Exercise 7.7 – Chemical and Biochemical Sedimentary Rocks
Performing an acid test is the easiest way to determine if you have calcite in your chemical rock. If you do not have acid, you can use hardness to distinguish carbonates from silicates as carbonates will scratch with a nail and silicates will not.
| Acid or Hardness Test | Rock Sample Numbers |
| Reacts with acid (has calcite) or is softer than a nail | |
| Does not react with acid (no calcite) or is harder than a nail |
Exercise 7.8 – Identifying Sedimentary Rocks
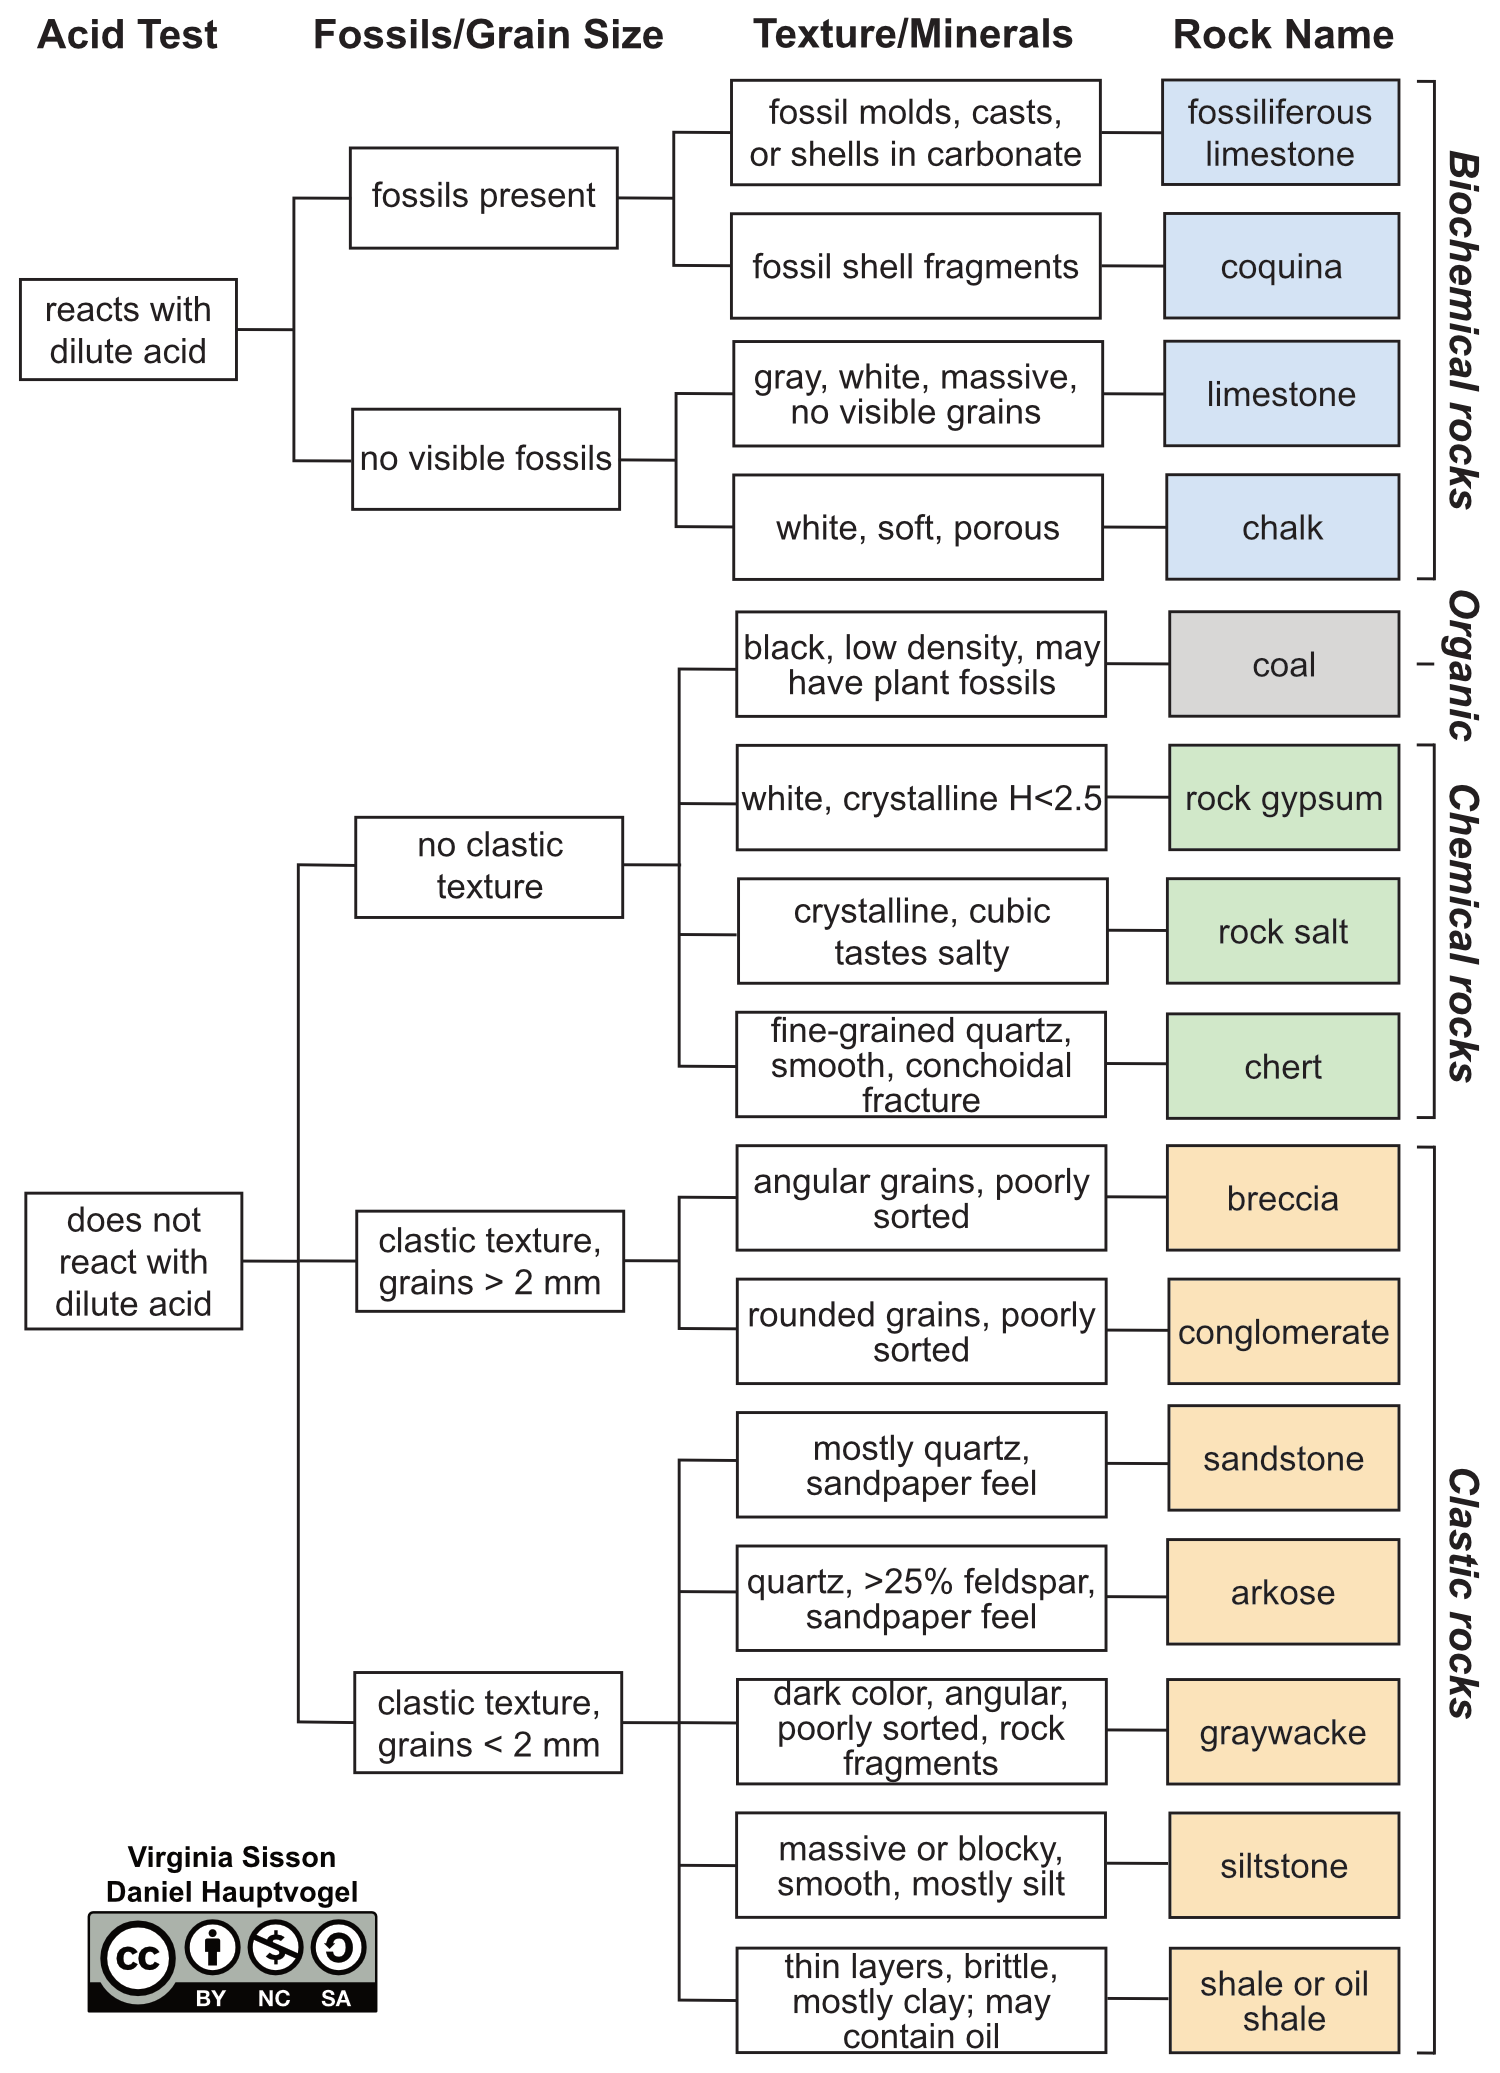
Using the characteristic information from the previous exercises, use the flow chart (Figure 7.12) to identify your unknown sedimentary rocks in Table 7.9.
| Sample | Classification | Grain Characteristics (size, shape, sorting) | Mineral Composition | Rock Name |
|
|
||||
|
|
||||
|
|
||||
|
|
||||
|
|
||||
|
|
||||
|
|
||||
|
|
||||
|
|
||||
|
|
||||
|
|
||||
|
|
7.4 Depositional Environments
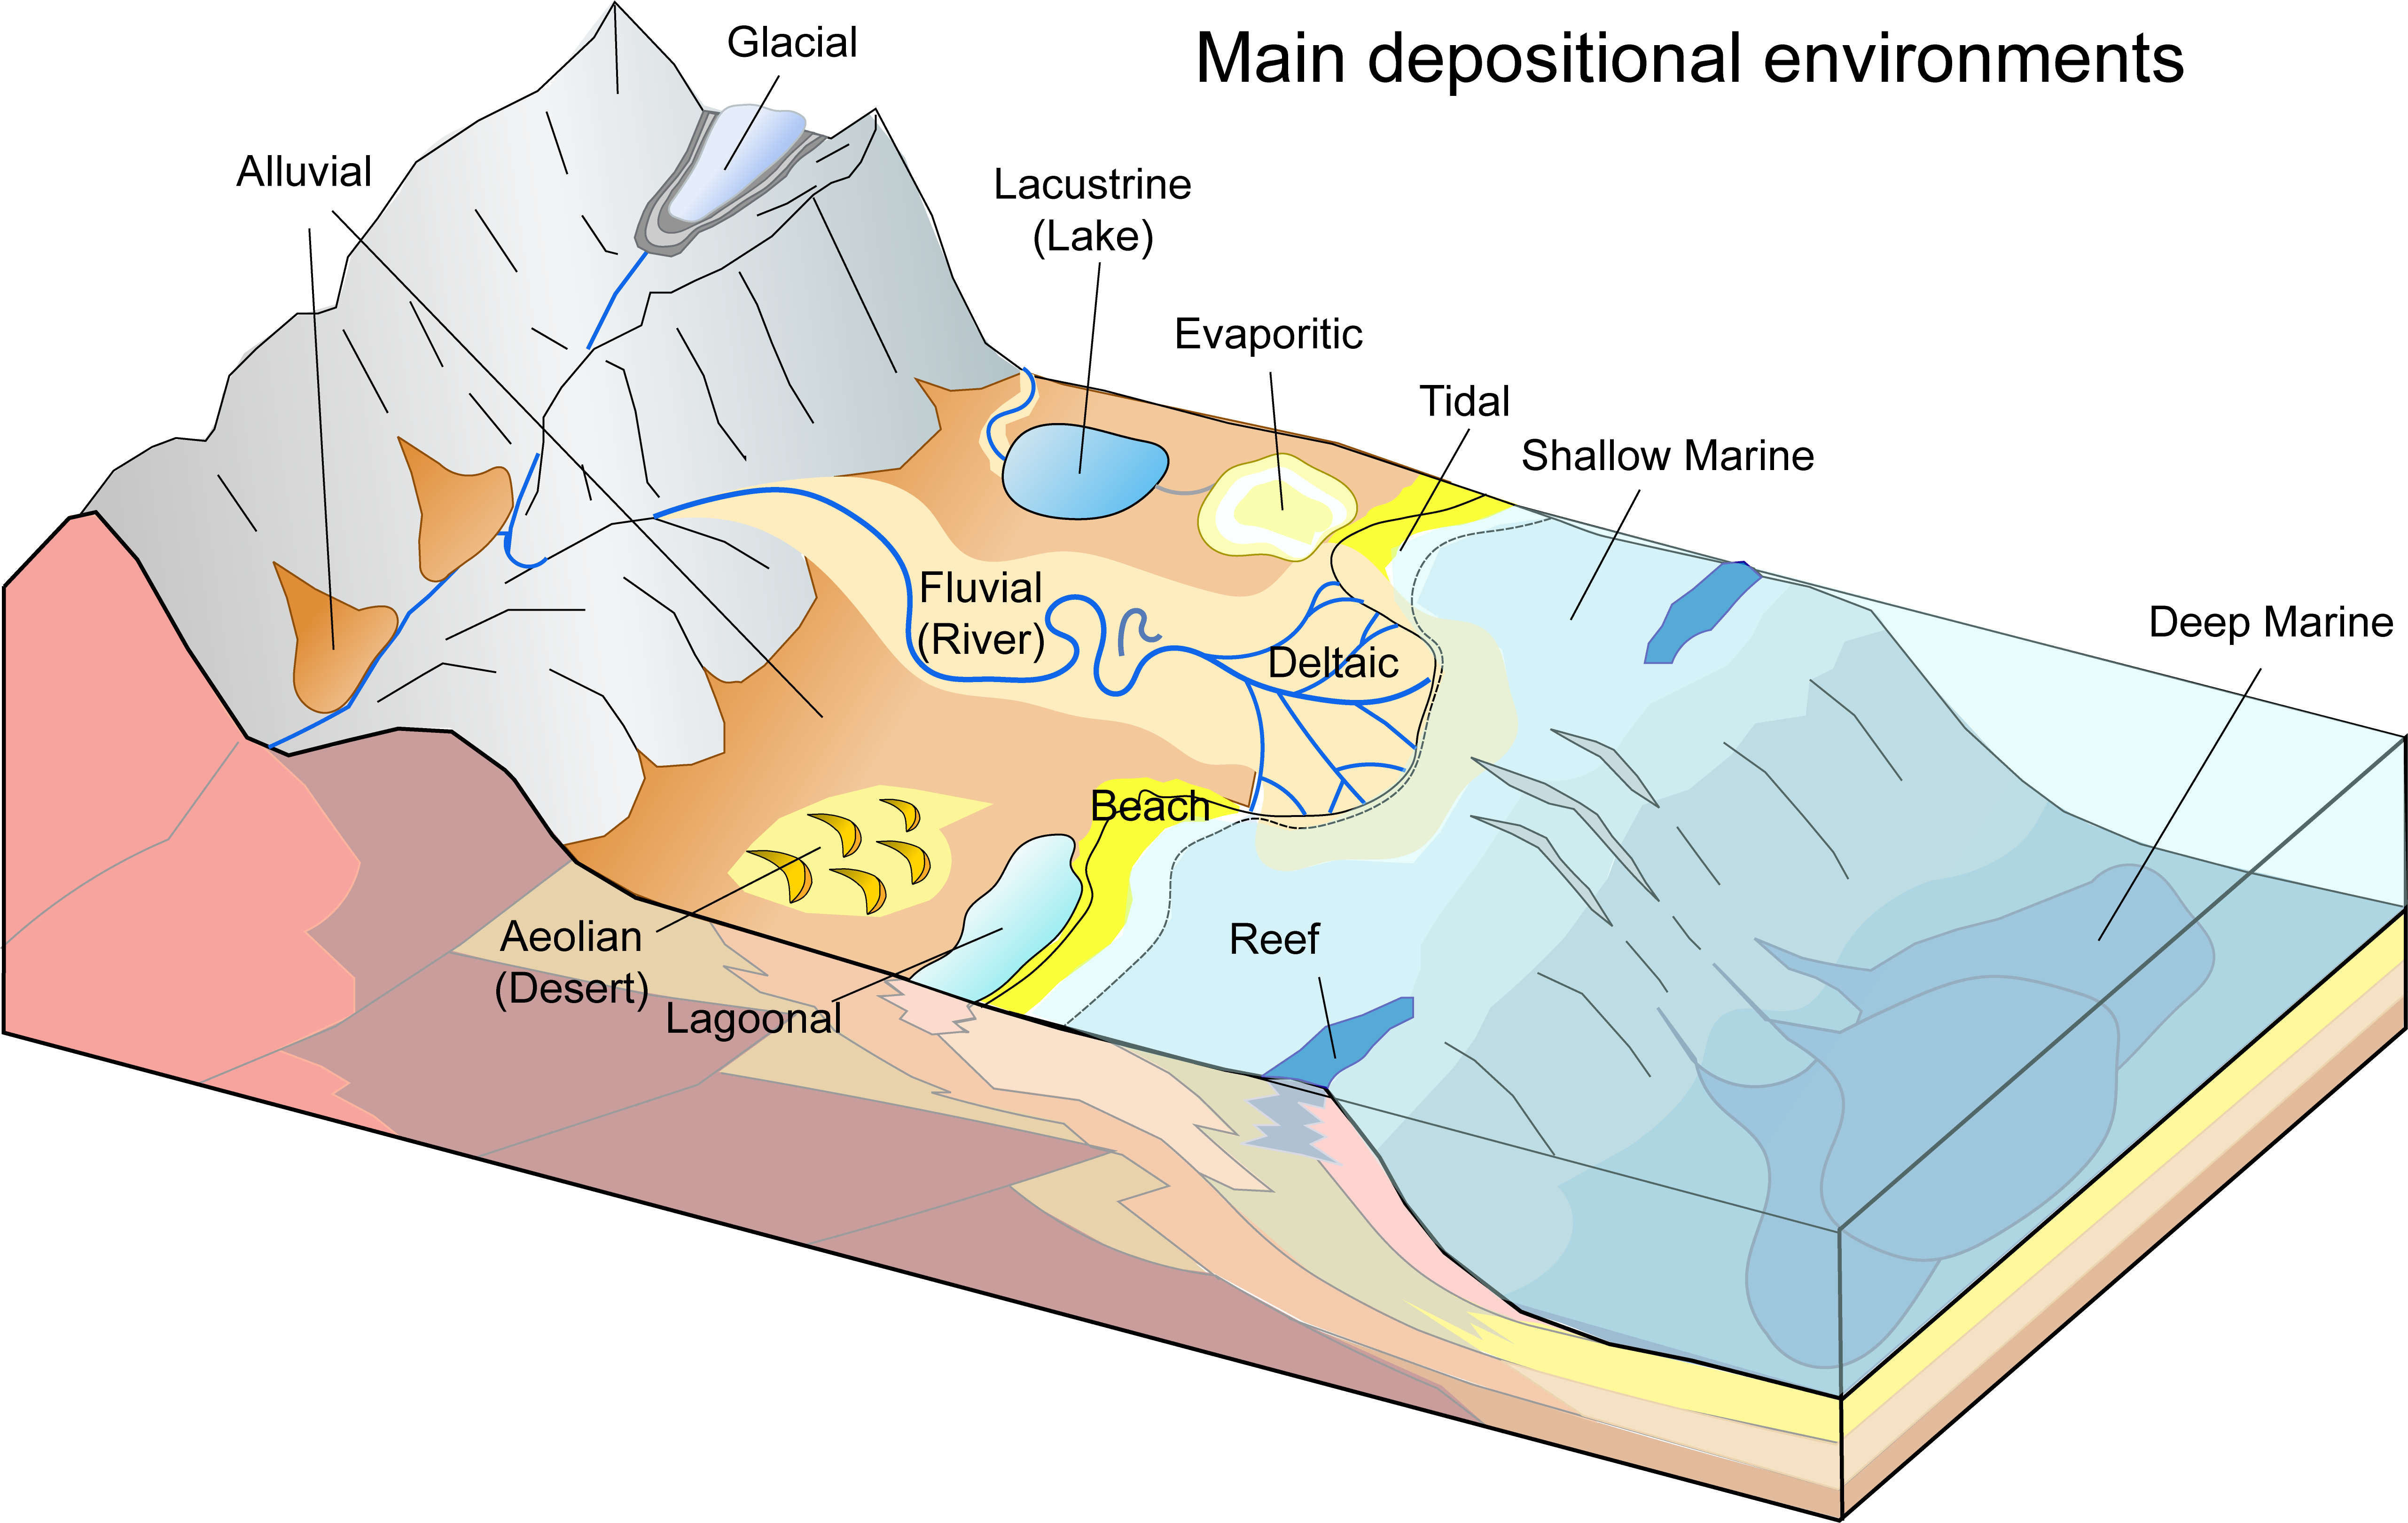
Sedimentary rocks contain clues that tell you about the environment was like at the time of their deposition. Interpreting depositional environments based on the sedimentary rock characteristics is a very important part of a sedimentary geologist’s job. There are a variety of depositional environments (Figures 7.13 and 7.14) that can be grouped into three broad categories: continental, marine, and transitional. Continental environments are areas where sediments are deposited on continents, marine environments are areas where sediments are deposited in the ocean, and transitional environments are coastal and tidal locations between continental and marine environments. Tables 7.10-7.12 contain the most common environments, a brief description of them, and the common sedimentary rocks that can form in those environments.
| Continental Environments | Description | Common Types of Sedimentary Rocks |
|---|---|---|
| Desert | Sediment deposited by wind; primarily deserts and coastal regions; well-sorted sand; typically red in color; variable energy. Example in Google Earth: Algeria. | Sandstone |
| Alluvial | Fan-shaped deposits caused by moving water; usually found in arid or semi-arid regions; contains gravel, sand, silt, and/or clay; poorly sorted; high energy; creates alluvial fans. Example in Google Earth: Death Valley National Park, California. | Conglomerate, breccia, sandstone, shale |
| River | Sediment deposited by moving water, primarily rivers; can contain gravel, sand, silt, and/or clay depending on how fast the water moves; variable energy; commonly red in color from oxidation. Example in Google Earth: Upper Mississippi River in Illinois/Missouri. | Conglomerate, sandstone, shale |
| Lake | Lake settings that can contain sand, silt, or clay; generally low energy. Example in Google Earth: Lake Winnipesaukee, New Hampshire. | Sandstone, shale |
| Glacial | Sediment deposited by glaciers; variable grain sizes; poorly sorted. Example in Google Earth: Southern Patagonia, Argentina. | Conglomerate, breccia, sandstone, shale |
| Evaporitic | Forms where water evaporates and leaves behind mineral precipitates. Example in Google Earth: Utah. | Limestone, rock salt, rock gypsum. |
| Transitional Environments | Description | Common Types of Sedimentary Rocks |
|---|---|---|
| Beach | Along coastlines, sediment transported by wave action; contains well-sorted gravel and sand; high energy. Example in Google Earth: Island Beach State Park, New Jersey. | Sandstone |
| Delta | Where a river empties into a body of water; contains gravel, sand, and silt; low energy. Example in Google Earth: Yukon River, Alaska. | Sandstone, shale |
| Lagoon | A shallow body of water separated from a larger body of water by barrier islands or reefs; very low energy; contains silt and clay. Example in Google Earth: East Matagorda Bay, Texas. | Limestone, shale, coal (swamps) |
| Tidal | Affected by the tides; mainly silt and clay; can create tidal flats; low energy. Example in Google Earth: Bay of Fundy, Nova Scotia. | Shale |
| Marine Environments | Description | Common Types of Sedimentary Rocks |
|---|---|---|
| Shallow | Located on the continental shelf; mainly sand and silt; energy decreases with distance from shore. Example in Google Earth: Eastern Gulf of Mexico. | Sandstone, shale, limestone |
| Deep | The deep ocean; very low energy; mainly clay; can contain turbidite deposits of variable sediment sizes. Example in Google Earth: Pacific Ocean. | Shale, chert, limestone |
| Reef | A bar of rock, sand, or coral. Example in Google Earth: Great Barrier Reef, Australia. | Limestone |
You’ll notice that the same type of sedimentary rock can be found in many different settings, making it difficult to determine the depositional environment. For example, deserts and beaches commonly leave behind deposits of quartz-rich, well-sorted sands. There may also be a wide variety of deposits within a single type of environment; for example, a slow-moving river may deposit silty mud in its channel, while a rapidly flowing river may deposit coarse sands and pebbles. Due to the variety in deposits and overlapping characteristics, it takes a well-trained eye to accurately determine the correct depositional environment for many sedimentary rocks.
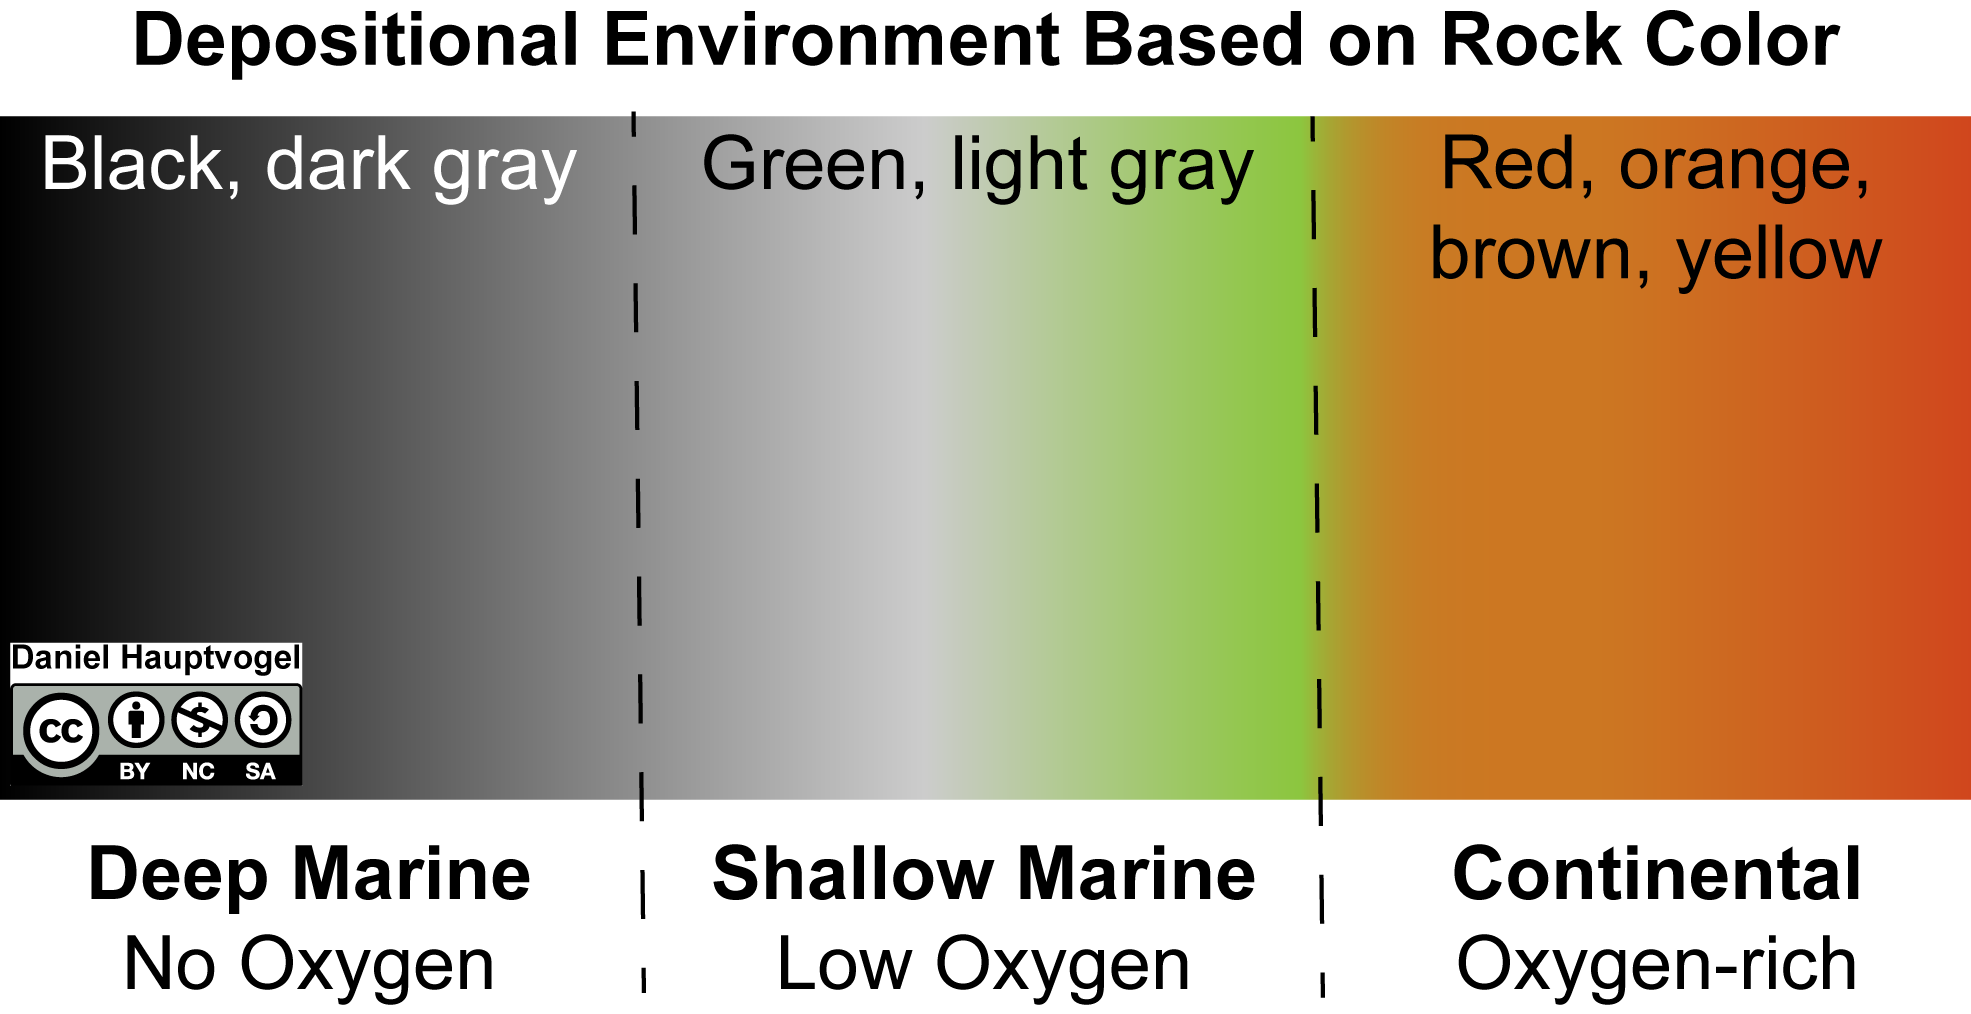
Sometimes, the color of a sedimentary rock can indicate the depositional environment because the color is largely determined by how much oxygen is available as the sediment is buried and lithified (Figure 7.15). Reddish colors can indicate oxygen-rich continental environments, like a flowing river or desert. Green and light gray colors mean low oxygen, which can be found in shallow marine environments. Black color means no oxygen, which would indicate a deep marine or swamp environment. Color is not always a good indicator, though, because the sediment only alters its color after burial. The conditions affecting buried sediment may not always match the environment on the surface above it.
Exercise 7.9 – Sedimentary Environments
Using Figures 7.13-7.15 and Tables 7.10-7.12, determine the most likely depositional environment for your sedimentary rocks (Table 7.13).
| Rock Sample | Depositional Environment |
- Critical thinking: Which sedimentary features are useful for determining whether the depositional environment is continental versus marine? Are there any sedimentary features that will determine the sedimentary environment with just one feature?
You observed the most common rock type covering North America is sedimentary rocks. Now that you can recognize different rock types and interpret where they were formed, you can start to explore geologic maps and better-understand the physical world around you. This information can be use to determine where to find economic resources such as limestone for concrete, shale to make bricks, sandstone as a place for fossil fuels and drinking water, and halite deposits for salt. The next exercise will explore some of the sedimentary rocks in Texas.
Exercise 7.10 – Sedimentary Rocks of Texas
Explore the geologic map of Texas. Each colored polygon represents a different rock unit. Clicking on the polygon will pull up information about that rock.
- Look near Austin, TX for the rock labeled “Ked.” Give is the name of this rock formation? ____________________
- List the types of sedimentary rocks are here?
- Are these clastic, chemical, biochemical, or organic rocks? ____________________
- Which rock samples from your kit would be similar to those in this rock group? ____________________
- What do you think was the depositional environment? ____________________
- Look at the extent of this rock group on the map. Describe its orientation. Why do you think it has this shape?
- Look near Marble Falls, TX for the rock labeled “Crh” (dark brown unit to the north). Give the name of this rock formation? ____________________
- List types of sedimentary rocks are here?
- Are these clastic, chemical, biochemical, or organic rocks? ____________________
- Which rock samples from your kit would be similar to those in this rock group? ____________________
- What do you think was the depositional environment? ____________________
- Look at the extent of this rock group on the map. Describe its orientation. Why do you think it has this shape?
Additional Information
Exercise Contributions
Daniel Hauptvogel, Virginia Sisson, Michael Comas
References
D. Dragovitch, 1986, Weathering rates of marble in urban environments, eastern Australia; Zeitschrift für Geomorphologie, v. 30, p. 203-214
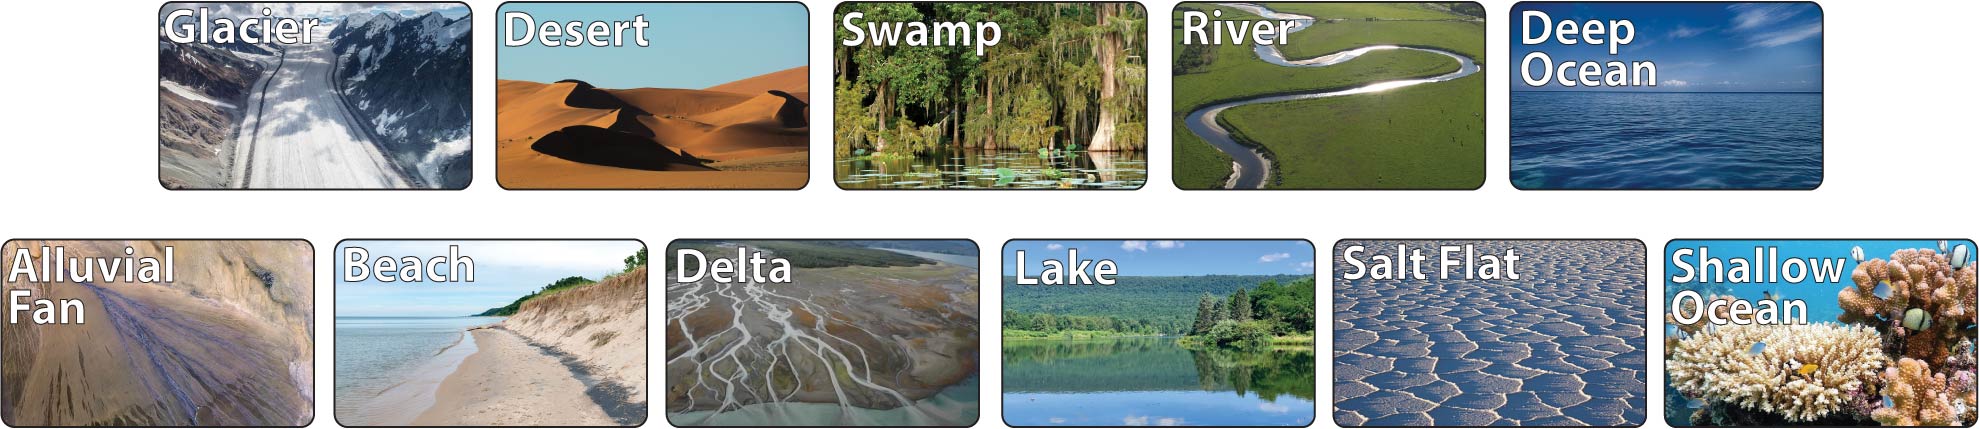
Image credits for Figure 7.14
- Glacier – Jacob Frank, Public Domain
- Desert – Pixabay user kuloser, Public Domain
- Swamp – Wikimedia user Pierre5018, CC BY-SA
- River – Simon Ledingham, CC BY-SA
- Deep Ocean – Johann Piber, Public Domain
- Alluvial Fan – NASA, Public Domain
- Beach – Michigan Department of Natural Resources, Public Domain
- Delta – NOAA, Pubic Domain
- Lake – Wikimedia user Zeete, CC BY-SA
- Salt Flat – Wallpaper Flare, Public Domain
- Shallow Ocean – Wallpaper Flare, Public Domain
a complex process in which loose grains of sediment are converted into rock. Lithification may occur when a sediment is deposited or later.
exertion of force on something so that it becomes denser
binding together of rock particles by cement
having minute spaces or holes through which liquid or air may travel
a white or colorless mineral composed of calcium carbonate. Often found in sedimentary rocks such as limestone and is deposited in caves to form stalactites and stalagmites
a hard white or colorless mineral consisting of SiO2, silicon dioxide, found in all rock types, the stable polymorph at the Earth's surface. It is often colored by impurities as in amethyst and citrine.
a shiny yellow mineral consisting of iron disulfide and typically occurring as intersecting cubic crystals. Also called fool's gold.
sedimentary rocks composed of fragments, or clasts, of pre-existing minerals and rock. These are typically the result of physical weathering.
sedimentary rock formed by chemical and organic reprecipitation of the dissolved products of chemical weathering.
a type of chemical sedimentary rock that have a biologic component to their origin.
sedimentary rock formed by the accumulation and lithification of organic debris, such as leaves, roots, and other plant or animal (shells or skeletal) material.
sometimes called forams; a single-celled planktonic animal with a chalky shell through which slender protrusions of protoplasm extend. Most are marine organisms, and when they die, their shells form thick ocean-floor sediments.
leaves, roots, and other plant or animal material
for organic matter, decay is rot or decomposition by the action of bacteria, insects and fungi
distribution of grain sizes in sedimentary rocks
the degree of smoothing from interaction of sedimentary particles.
