
6 Interacting with data through visualization technology
Data visualization is the process of using a graphical presentation to display quantitative information and other data. The reasoning behind integrating data through forms of visualization technology is an increase in viewer engagement. Presenting data in such a way can increase understanding of concepts and allow viewers to absorb information more quickly. When presenting data, it is important to remember a few simple questions.
- Who is the target audience?
- What do you want your visual to achieve?
- What data visualization tool will best suit the data?
Using an immersive presentation style may be the way to represent larger data. See some options below.
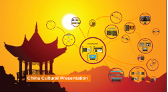
Prezi
Description: A multimedia presentation tool that is different from traditional presentation programs. Prezi uses motion and zoom technology to create a flowing presentation that highlights the entire presentation while zooming in on key points.
Cost: Free with account registration for basic designs and templates
Usage: Slide presentation
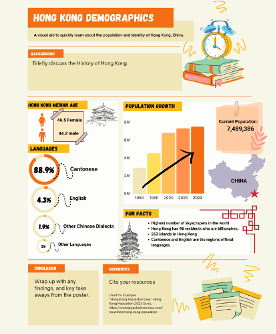
Canva
Description: A graphic design tool that allows users to create colorful and engaging materials with their easy-to-use software. With its database of up-to-date graphics, Canva is a great tool for quickly creating content with vivid colors and animated graphics. With predesigned templates, this tool is guaranteed to be beginner friendly.
Cost: Free with account registration for basic design and templates
Usage: Slide presentations, posters, social media graphics, and logos
Example: Hong Kong Demographic created through Canva
Google Earth
Description: This software uses satellite imaging to capture geographic data around the world and allows users to navigate worldwide terrain and sites in any city imaginable.
Cost: Free
Usage: Geographical presentations (landmarks, cities, regional terrain)
Example: The Great Wall of China Presentation

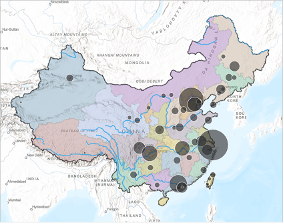
ArcGIS
Description: A software to view, edit, and analyze geographic data. This database allows the user to input statistics and create maps and scenes that represent data with actual geographics instead of written statistics. The website also allows cooperative work as projects can be easily shared between members.
Cost: Free with account registration
Usage: Create maps with environmental data
Media Attributions
- Prezi Presentation on China Culture © Liza Caprino is licensed under a All Rights Reserved license
- banner_canva © Alejandra Gomez is licensed under a CC BY-NC (Attribution NonCommercial) license
- Google Earth Project © Harrison Quinn is licensed under a All Rights Reserved license
- ArcGIS Project of Map of China © GIS Mapping Software is licensed under a CC BY-NC-SA (Attribution NonCommercial ShareAlike) license
