
6.4.2 Chapter Practice 2: FDA Recall Data
In this chapter practice, we will look at how we can make sense of data we have never seen before. We are set to work with an Excel file called FDA_Recalls_Trends_2005-14.xlsx. (We will download this file a bit later on this page once we went through this exercise.)
Why start with the context? Because having a general understanding of what we will find in the data will allow us to process it faster. Therefore, before we open the file and we must start with the file name tells us.
What is FDA? What are recalls in general, and what does the word trends mean?
“The Food and Drug Administration (FDA) is responsible for protecting the public health by ensuring the safety, efficacy, and security of human and veterinary drugs, biological products, and medical devices; and by ensuring the safety of our nation’s food supply, cosmetics, and products that emit radiation (Source).”
We may not know what the FDA is off the top of our head, but we live in an age where we encounter recalls on a regular basis. Some of the most notable recalls of 2019 were regarding romaine lettuce, but there are more store, brand or product-specific recalls that have impacted HEB, Kroger, Wal-mart and their produce. One of the most notable Texas recalls impacted a beloved ice cream brand again and again. Recalls may impact food products, but there are many recent recalls that have impacted technology or devices we use every day. The much-publicized recall of the Galaxy Note 7 cost Samsung over $5 billion. A recent Volkswagen recall impacted hundreds of thousands of consumers, while the Takata Airbag recalls are impacting tens of millions of drivers. Recalls happen everywhere: from India to Indiana. Recalls impact consumer health and may cause fatalities.
What is a Food Recall?
A food recall is when a food producer takes a product off the market because there is reason to believe that it may cause consumers to become ill. In some situations, government agencies may request a food recall. Food recalls may happen for many reasons, including but not limited to:
- Discovery of organisms, including bacteria such as Salmonella or parasites such as Cyclospora.
- Discovery of foreign objects such as broken glass or metal.
- Discovery of a major allergen that does not appear on the product label.
Why Do Food Recalls Matter?
“Food recalls are most importantly a public health issue, but they are also significant economic issues. The average cost of a recall to a food company is $10M in direct costs, in addition to brand damage and lost sales according to a joint industry study by the Food Marketing Institute and the Grocery Manufacturers Association. However, the costs for larger brands may be significantly higher based on the preliminary recall costs reported by firms of some recent recalls.” A single product’s recall can lead to an entire industry to lose hundreds of millions as a whole.
Source: Recall: The Food Industry’s Biggest Threat to Profitability
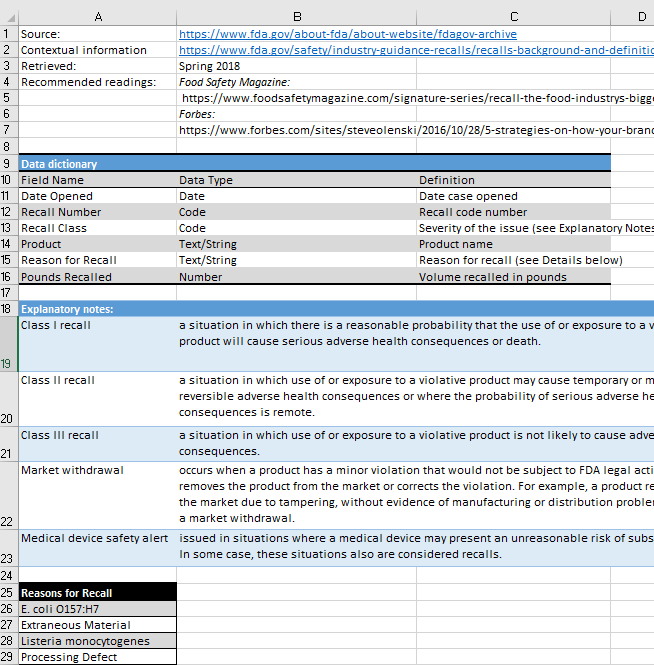
Let’s look at the Info sheet in the workbook!
Now that we have considered why we should invest in looking at this data, download the FDA_Recalls_Trends_2005-14 Excel file to your class folder on your computer and open it. Our data file is going to show us data from 2005 to 2014. We can generally use multiyear data to see if we can spot trends or patterns.
- How big is the data file? > Is its size measured in kilobytes, megabytes or gigabytes? Why does this matter?
- Is there a data dictionary? > Read it! What can we learn about the data based on it? What can we do with field names that do not make sense when we read them?
- What is the source of your data? > What can we do it there is no source noted?
- Do we know who collected the data? > Do we know why? If not, then what?
- What is its purpose of this data? > Does the source say what the purpose of this file is? If they do not, then what should we do?
- Do you like the structure and the colors of the data dictionary? > If you do not, what can you do?
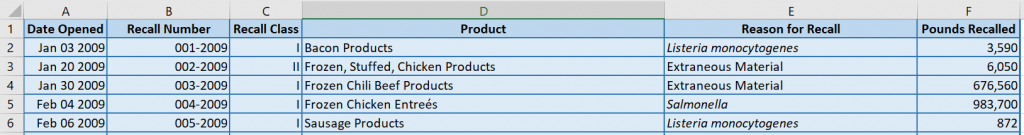
Let’s look at the Data sheet!
- How much data is in the file? > Highlight the full range using CTRL+SHIFT+RIGHT KEY, DOWN KEY, how many cells are highlighted?
- How many field names (columns)? How many records (rows)?
- Do the field names make sense?
- What types of questions can you answer with the data?
- What functions do you know in Excel that will help you process data?
How would you process this data?
Sample Questions
3. How many pounds of Spaghettios were recalled?
Answer Key
FDA Data practice by Emese Felvegi is licensed under CC BY 4.0.
Media Attributions
- DataDict
- FDAData
