
8.4 Chapter Practice
National Highway Traffic Safety Administration – Takata Airbag Recalls
In this Chapter Practice, you will combine your Excel knowledge and skills with information you gather from the internet regarding the ongoing Takata airbag recalls. “Vehicles made by 19 different automakers have been recalled to replace frontal airbags on the driver’s side or passenger’s side, or both in what NHTSA has called “the largest and most complex safety recall in U.S. history.” The airbags, made by major parts supplier Takata, were mostly installed in cars from model year 2002 through 2015. Some of those airbags could deploy explosively, injuring or even killing car occupants. (Source: Consumer Reports, 2019)”
You are likely familiar with the Takata airbag recalls from news items from the past few years, you may even be or know someone with a vehicle impacted by the recall. Overall, this issue impacts about “41.6 million vehicles equipped with 56 million defective Takata air bags [that] are under recall because these air bags can explode when deployed, causing serious injury or even death. (Source: National Highway Traffic Safety Administration, 2019)”
Practice Objectives
- Read news items and documentation to understand the context of your data set.
- Understand the structure and contents of your data file.
- Create Excel tables, PivotTables, and Pivot Charts.
- Use slicers and filters to find answers to relevant questions.
- Use logical functions and create nested functions to find answers in your data.
Go to the National Highway Traffic Safety Administration and Consumer Reports websites and review the information shared there. There is a lot to read through, but spending time with the context of your data will allow you to be more informed on a topic if you decide to discuss your work with the related data at a job interview. (There are additional readings and media below for those wanting to immerse themselves in this topics.)
- Create a folder on your computer for “Takata Data Project”.
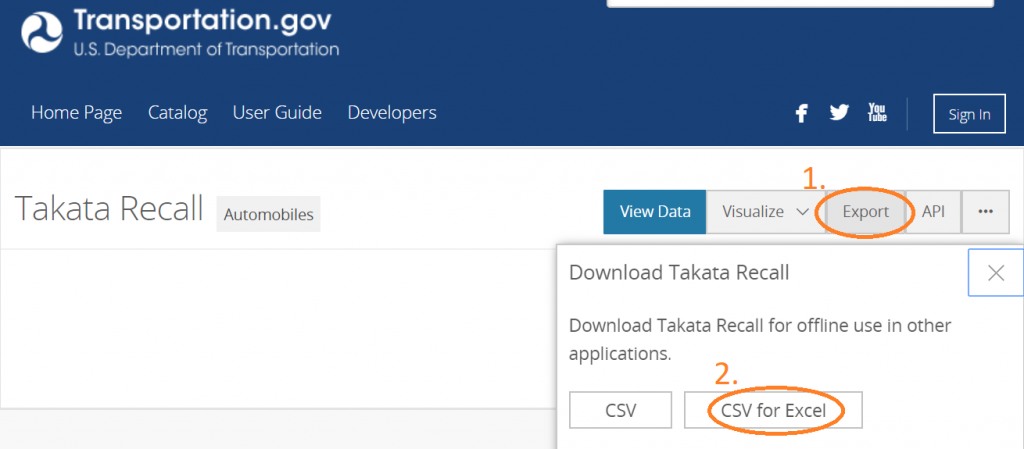
- Download this Takata_Recalls_10-2019 Excel file to your computer. (This file is archived here for educational purposes from USDOT to ensure the consistency of assignment questions.)
- Open the Takata_Recalls_10-2019 Excel file you have downloaded. There are three sheets in this workbook. The “Info” sheet notes the source of the data, the “Data Dictionary” sheet provides the explanation and data types for the field names in the data. The third sheet is the “Takata_Recall” sheet and it contains 14 columns and 14282 rows, totaling to 198,380 individual points of data. As you look at the header row, the field names don’t necessarily need an explanation if you have a basic understanding of the context, but for some of the data types you will have to refer to your Data Dictionary sheet as you move ahead.
- Next, rename your data file to Takata_Recalls_YourName.xlsx.
- Insert a Pivot Table based on “Takata Recall” sheet in your workbook, insert the PivotTable into a new sheet based on the Takata_Recall!$A$1:$N$14282 range. Move the sheet to the end of the workbook in the hierarchy.
- In the new sheet, establish the Average Completion Rate for the recalls so far. Drag the correct field in the right location. (Note: The data type is already an average. However, when you move the field name to the Pivot Table Field Selector under Values, make sure you change the Field Settings to show an AVERAGE and not a COUNT or SUM.) Round the output to two decimals. Rename the Sheet “to Ave_Rate”.
- Next, add the Manufacturer field under the ROWS in the PivotTable Fields. What does this output show? Which manufacturer has the highest or lowest value? Is a higher value good or bad?
- Next, add the Driver/Passenger field under COLUMNS. What does this output show? Which manufacturer has the highest or lowest PAB and DAB values? Which manufacturer has the least or most to do yet?
- Go to the Takata_Recalls sheet. Insert a new PivotTable into a new sheet, move its sheet at the end of the workbook.
- In the new sheet, in the Pivot Table Field Selector, click the Report Date field. Where did Excel assign this field? How did Excel group your data? Consider what this grouping of your data will allow you to do. What does the increase of numbers mean over time? Rename the Sheet to “Report_Date”.
- Go to the Takata_Recalls sheet. Insert a new PivotTable into a new sheet, move its sheet at the end of the workbook.
- In the new sheet, in the Pivot Table Field Selector, move the Manufacturer field under ROWS, the Total Air Bags Repaired under the Values field. What does this output show?
- Filter this PivotTable for Recall Campaign 14V787. Which manufacturers and how many air bags are shown?
- Next, we will practice some other skills. Go to the Takata_Recalls sheet. Insert an Excel Table (confirm the range as =$A$1:$N$14282).
- We want to find out the average of scrapped airbags in campaigns that have a completion rate of 50% and above. We can do this using a variety of methods.
- Method 1: Filter your table, add a total row, calculate the output for your desired fields.
- Method 2: Insert a column next to column N and enter “Criteria 1” as the field name. Add a logical function that evaluates the Completion Rate and outputs to a Yes/No. Pivot your findings.
- Method 3: Use the AVERAGEIF conditional function to return an output.
- Regardless of method, your output should be 10,981 (rounded to 0 decimals).
- Next, we want to find out how many campaigns are on our list with 50,000 or more Net Air Bags Remaining. We can do this using a variety of methods.
- Method 1: Filter your table, add a total row, count the output for your desired fields.
- Method 2: Insert a column next to column O and enter “Criteria 2” as the field name. Add a logical function that evaluates the Net Air Bags Remaining and outputs to a Yes/No. Pivot your findings.
- Method 3: Use the COUNTIF conditional function to return an output.
- Regardless of method, your output should be 3,590.
- Next, we want to find out how many Passenger Airbags were Scrapped from Priority Group 10. We can find an answer using a variety of methods.
- Method 1: Filter your table, add a total row, SUM up the airbags based on selecting criteria for your desired fields.
- Method 2: Insert a column next to column P and enter “Criteria 3” as the field name. Add a nested logical function that evaluates criteria to a Yes/No. Pivot your findings.
- Method 3: Use the SUMIFS conditional function to return an output.
- Regardless of method, your output should be 1,537,776.
- Save your work for your records.
Additional Readings
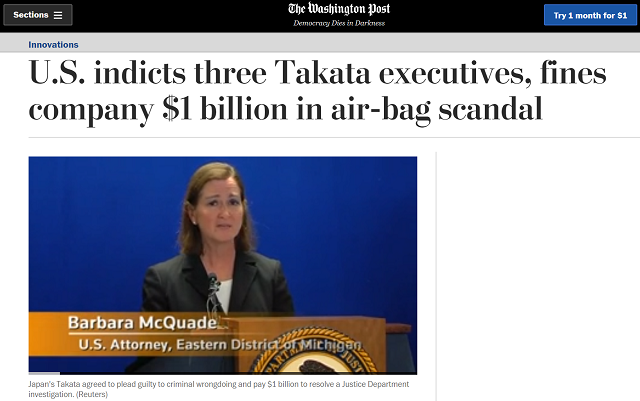
For legal considerations of this issue, read the following article from The Washington Post: U.S. indicts three Takata executives, fines company $1 billion in air-bag scandal.
For ethical considerations of this issue, read the following article from The Japan Times: Takata whistleblower says warning to U.S. authorities over air bag flaws was his ‘ethical duty’.
For supply chain considerations of this issue, read the following article from Supply Chain Dive: How product recalls spread through the supply chain.
For management related considerations of this issue, read the following article from Fortune: Here’s How the Takata Air Bag Recall Could Have Been Avoided.
Additional Exercises
The NHTSA periodically updates the recall data. You may return to their website to download the latest set of data and practice your skills using timely data.
https://datahub.transportation.gov/Automobiles/Takata-Recall/8u28-hw9f
Attribution
Chapter Practice by Emese Felvégi & Nick Baudoin, licensed under CC BY 4.0.
Media Attributions
- WaPo_McQuade
- Takata_Datahub
