37 How to Use Data to Tell Stories?
Data analysis is a very important skill set for scientists because models are built on the results that we see in the experiments, and if we are able to properly analyze our experimental data, we are able to formulate models that better represent reality.
But data analysis is the only half of the story!
The other half is that you also need to be able to:
- Communicate your finding to others
- Convince others that you have found is indeed correct!
That is when storytelling comes in mind!

What Is Data Storytelling?
The ways in which organizations deliver business intelligence and analytics insights are evolving, notably in the rising use of what is called storytelling.
Data storytelling is combining explorative data visualization with narrative techniques to deliver insights in a way that engages with decision-makers in a compelling and easily assimilated form.
Data Visualization
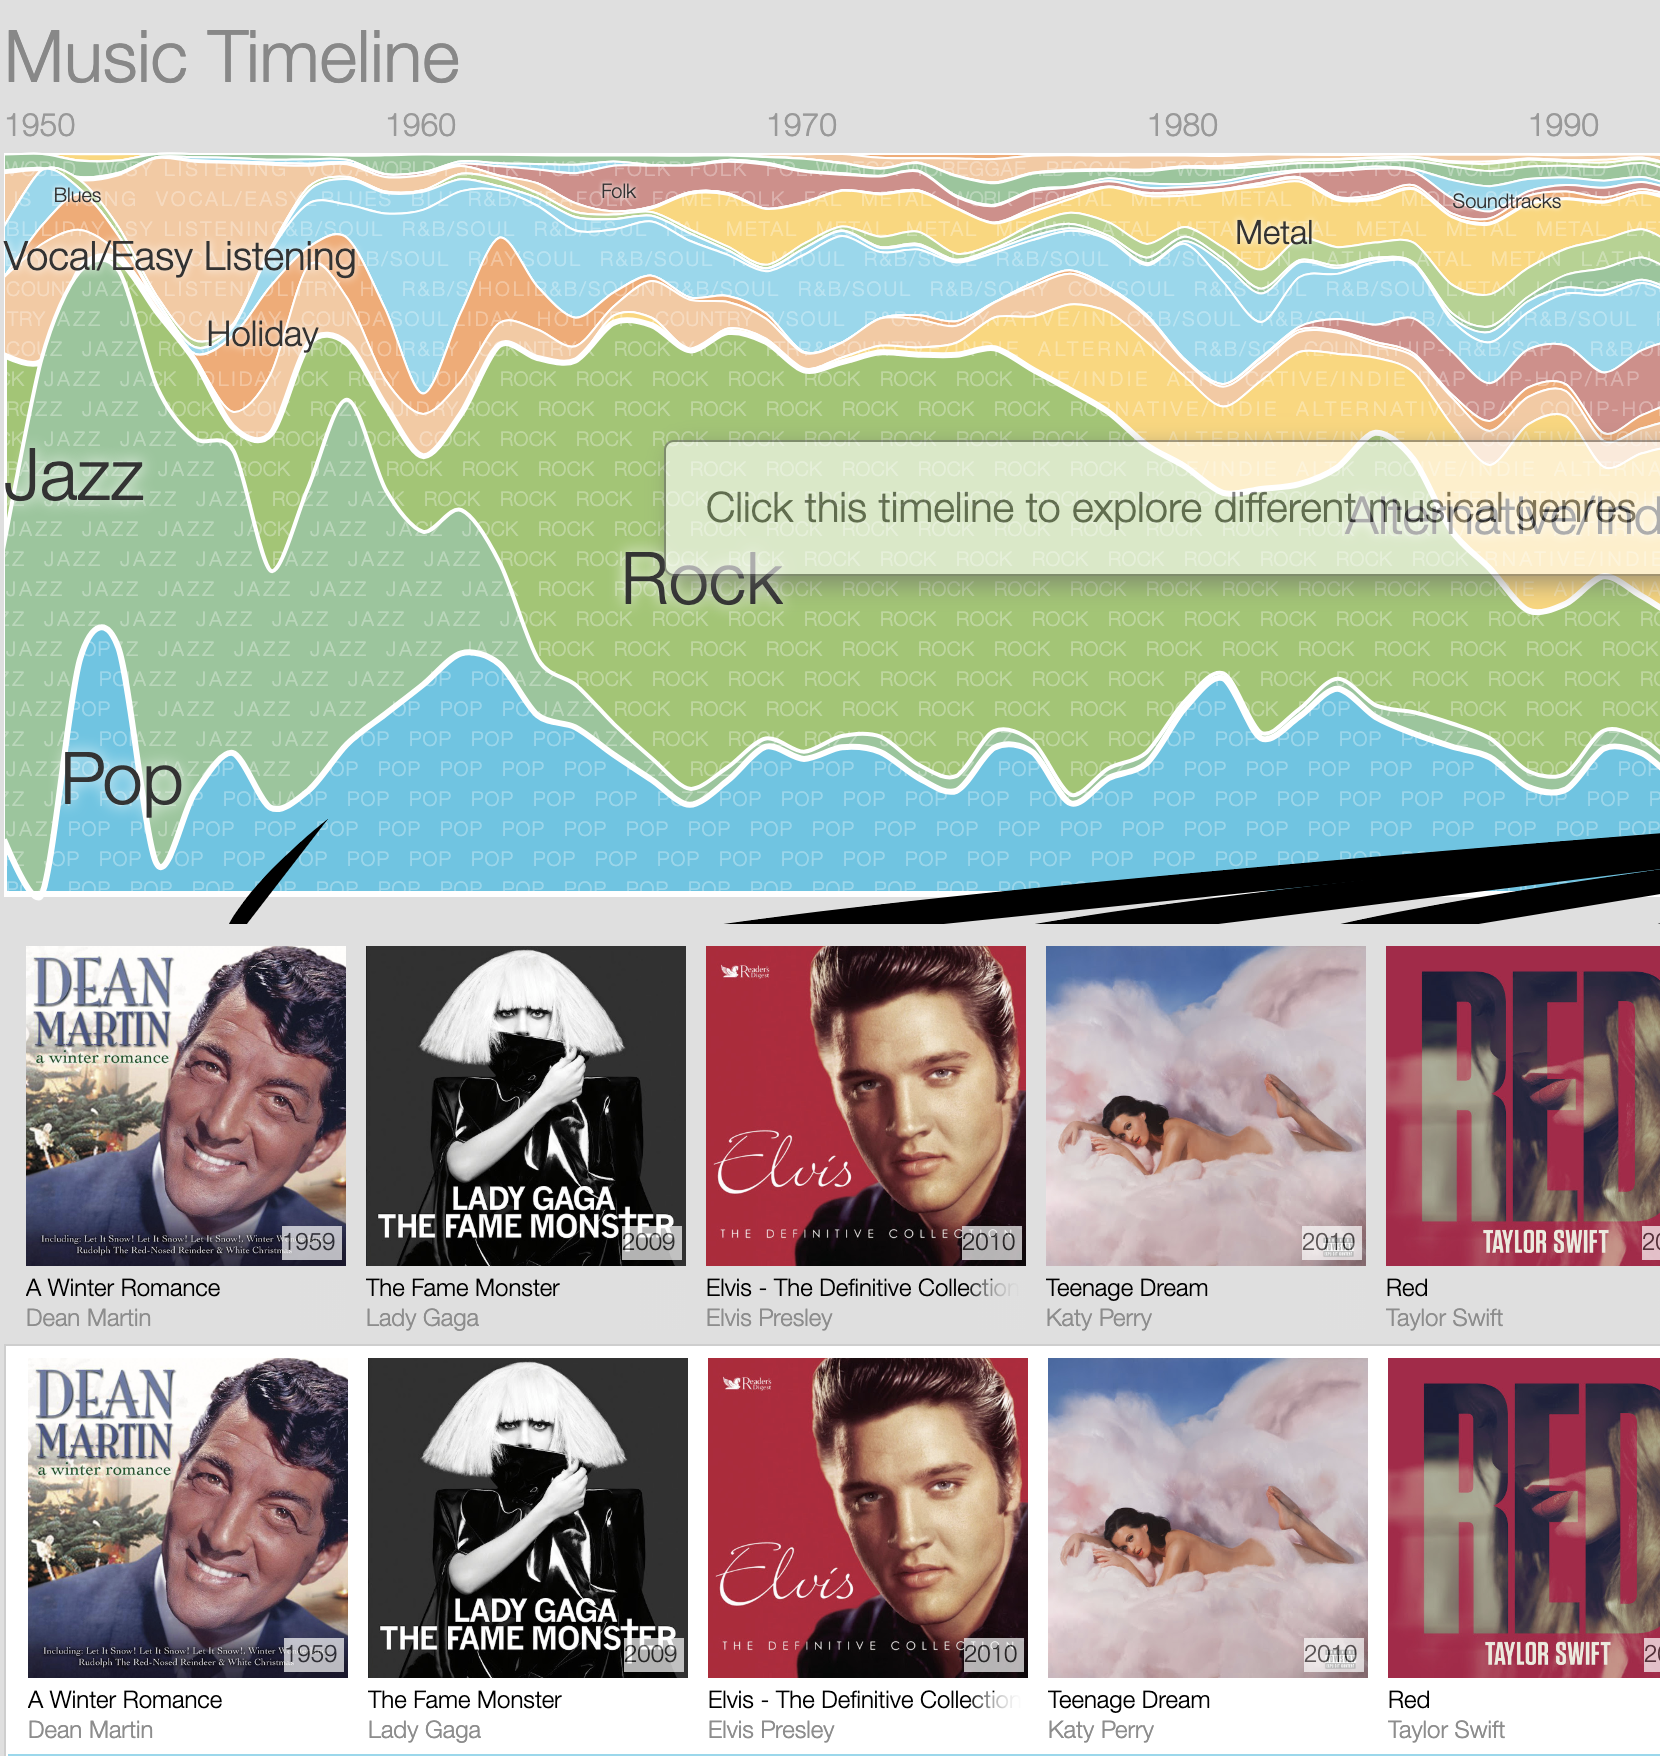
Interactive visualization enables the exploration of data via the manipulation of a battery of chart images, with the color, brightness, size, shape, and motion of visual objects representing aspects of the dataset being analyzed.
This capability enables people to analyze data by interacting directly with its visual representation.
For example, Google Research has a visual timeline for musical history.

Data storytelling and data visualization work together!
How to Tell the Story?
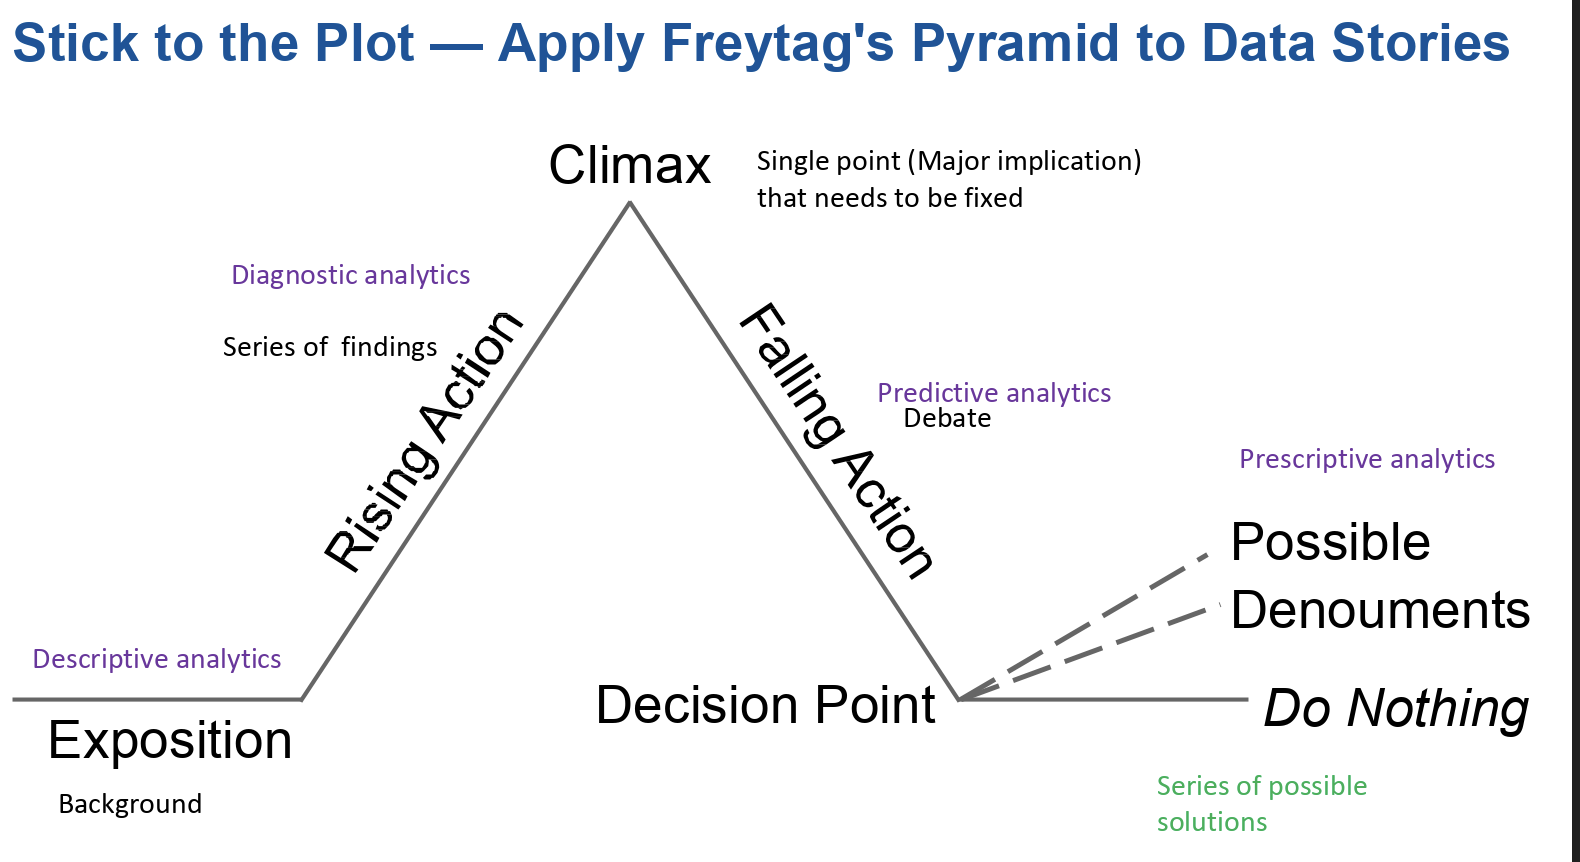
As all the stories use we apply Freytag’s Pyramid to data stories!

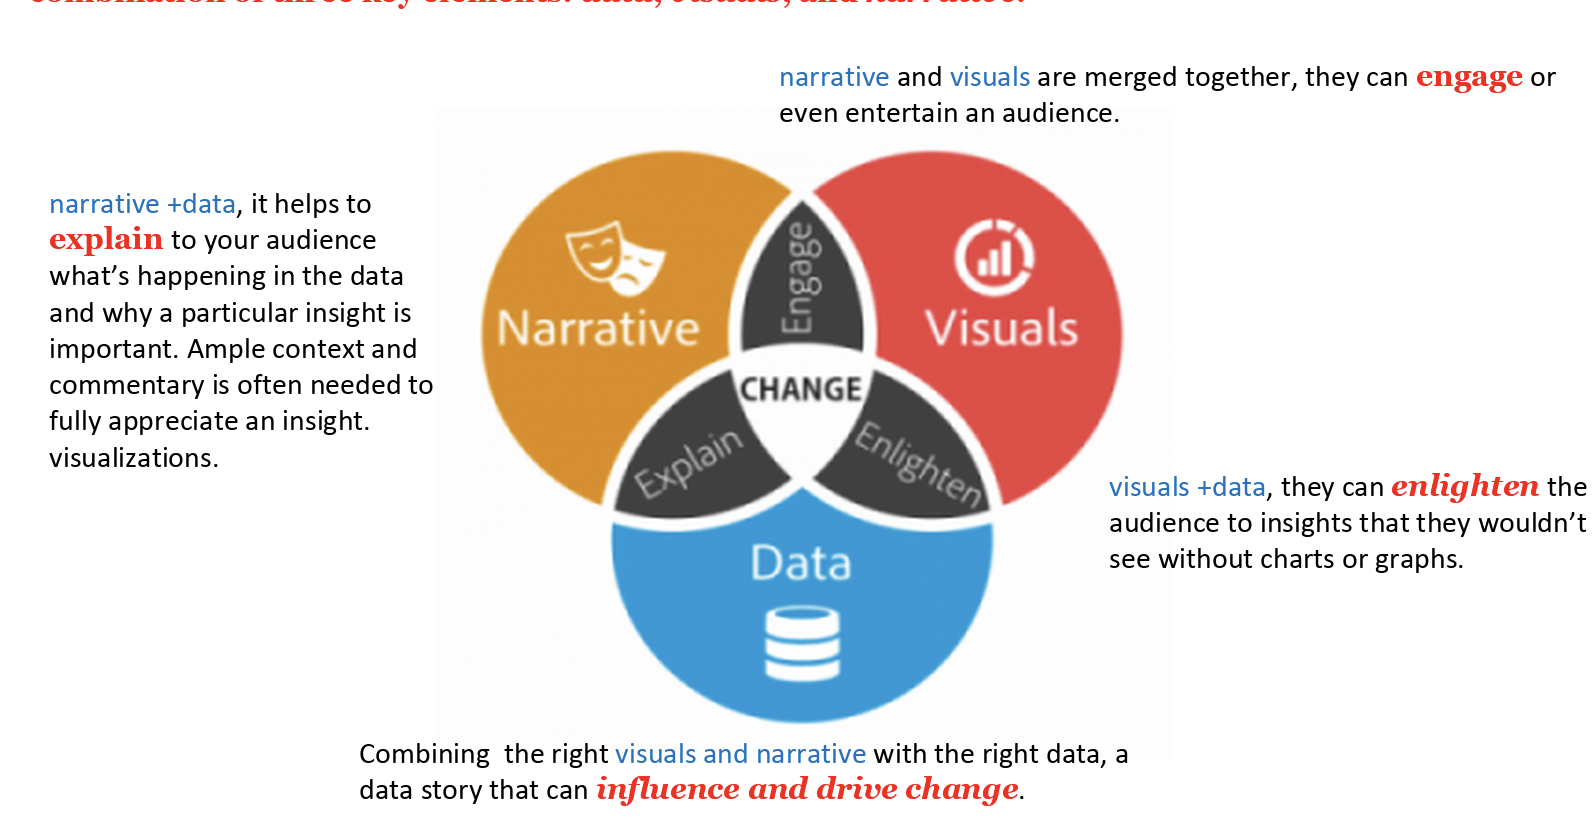
Data storytelling is a structured approach for communicating data insights, and it involves a combination of three key elements: data, visuals, and narrative.

Is Data Story Reliable?
Some data stories are not reliable. In order to detect them we can use Carl Sagan’s “Beloney Detection Kit”:
- “Wherever possible there must be independent confirmation of facts”
- Encourage substantive debate on the evidence by knowledgeable proponents of all points of view.
- Arguments from authority carry little weight — “authorities” have made mistakes in the past.
- Spin more than one hypothesis.
- Try not to get overly attached to a hypothesis just because it’s yours.
- Quantify.
- If there is a chain of argument, every link in the chain must work!
- When faced with two hypotheses that explain the data equally well, choose the simpler.
- Always ask whether the hypotheses can be, at least in principle, falsified

