
7 Financial Statement Analysis
Learning Objectives
- Discuss the need for financial statement analysis.
- Identify the tools of financial statement analysis.
- Explain and apply horizontal analysis.
- Explain and apply vertical analysis.
- Identify and explain ratios analysis.
Need for Analysis
Businesses communicate their financial results via their financial statements. If you look at an income statement and see a net income of $10,000, what will you say about this company? Good? Bad? So-so? And how can it be bad? It is making money? But what if this company is in an industry that every other competitors are all netting millions, and this one only netted $10,000? Thus, there is a need for financial statement analysis.
When analyzing the financial data of a company, you can compare a company to itself. This is called intracompany comparison or analysis. You may wonder why do I need to compare me to myself? Well, perhaps you want to see if you make more money this year than last year. Or, you can compare your actual results to your budgeted amounts. On the other hand, you can also compare yourself to the entire industry. There are many industry standards available to you. At the UH Library, you can access an e-version of RMA. All industries are given a code and you simply look up the code for the industry a company belongs and you can compare your results to that of the industry. Below are some examples:
- § Dun & Bradstreet
- § RMA – Risk Management Association’s Financial Ratios Benchmarks (will probably see in other classes)
- § Standard & Poor’s
- § Moody’s
In addition, for the hospitality industry, Smith Travel Research (STR), CBRE, and HVS all provide various statistics, from operational to financial, for management and owners. If you work in the hotel segment of the hospitality industry and especially if you are in the front office, you might have heard of the the STAR report from STR.
Tools of Financial Statement Analysis
The three major tools for financial statement analyses are horizontal analysis, vertical analysis, and ratios analysis. You might have used some of them and just never knew their academic name. Horizontal analysis is also called comparative analysis. It is looking at least two points in time or in other words, over a period of time, to see how the account value changes. There are two calculations in horizontal analysis: $ change and % change.
Vertical analysis is also called common size analysis, as the goal is to express each line-items as a % of a common base (thus the name common-size), where the base is always 100% and thus each line-item (or each account) makes up a percentage of the total.
Ratios analysis is expressing relationships between two accounts where one number is divided into another to obtain a percentage, times, or a proportion.
Horizontal Analysis
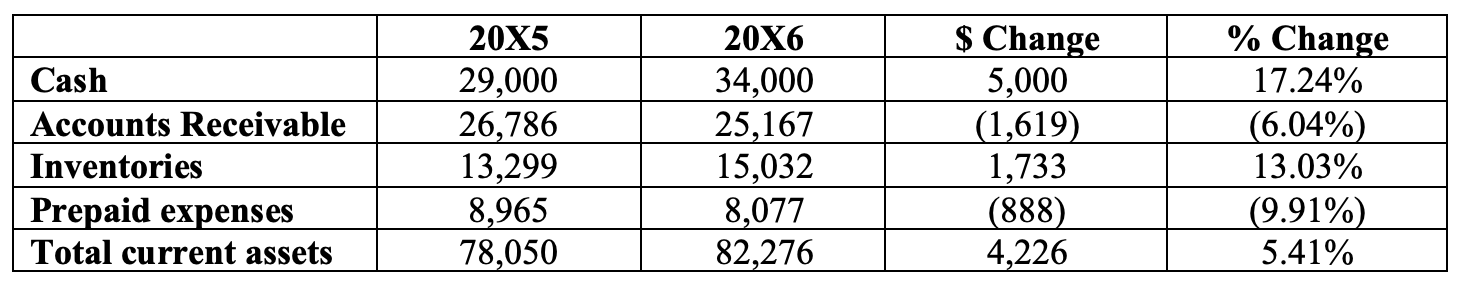
Take a look at the cash account in the example below. Again, horizontal analysis look at two points in time and calculate first the dollar change. Then, the dollar change is divided into the base (old, or beginning) amount to obtain the % change. It is the same principle as if you have your first raise in your first job. You made $10 an hour and now your boss gives you a raise and pays you $12. When you go home and share the good news with your parents, they ask, “What is the raise?”, and you say “$2” because you used your new pay $12 to minus your old pay “$10”. And, when they ask, “What is the percentage raise your boss gave you?”, and you say “20%” because you used your raise in dollar, $2, and divide that over your old pay of $10.
Examples: Horizontal Analysis
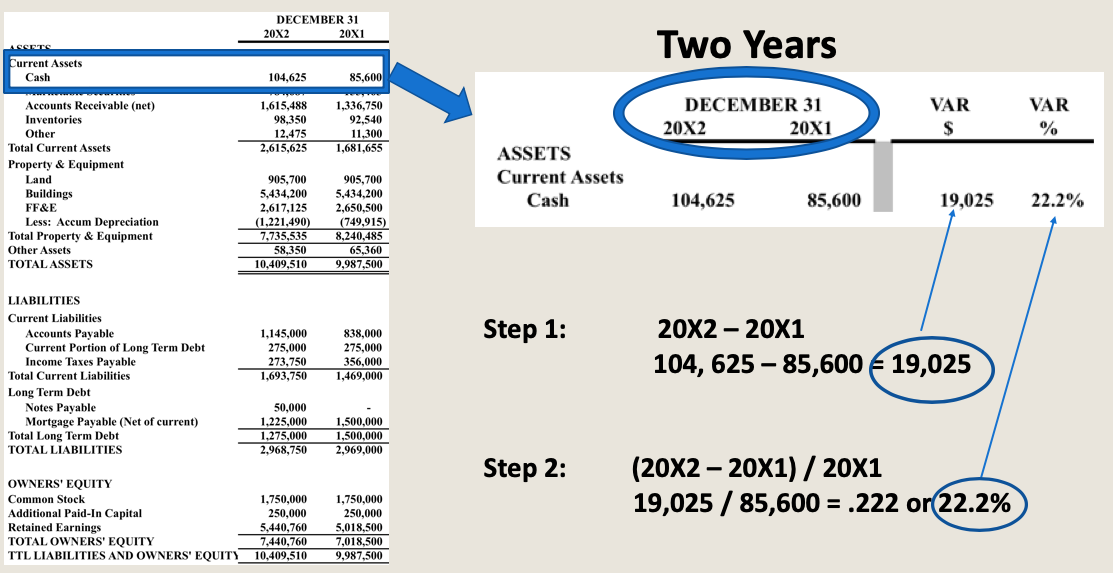
Key Takeaways: Horizontal Analysis Formula
Horizontal analysis dollar change = Current Year Amount – Base Year Amount
Horizontal analysis percentage change = (Current Year Amount – Base Year Amount) / Base Year Amount
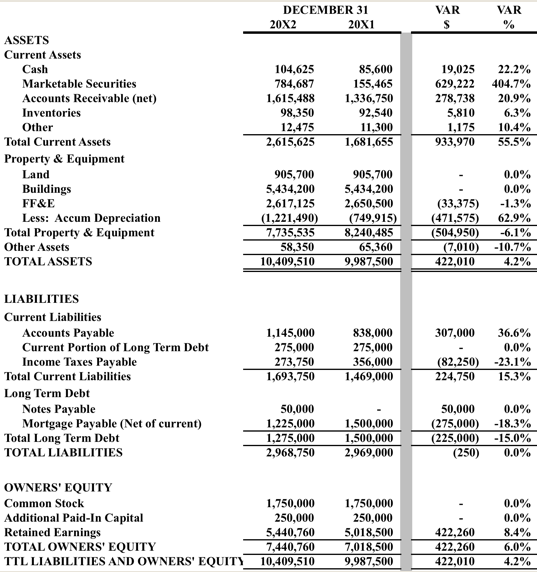
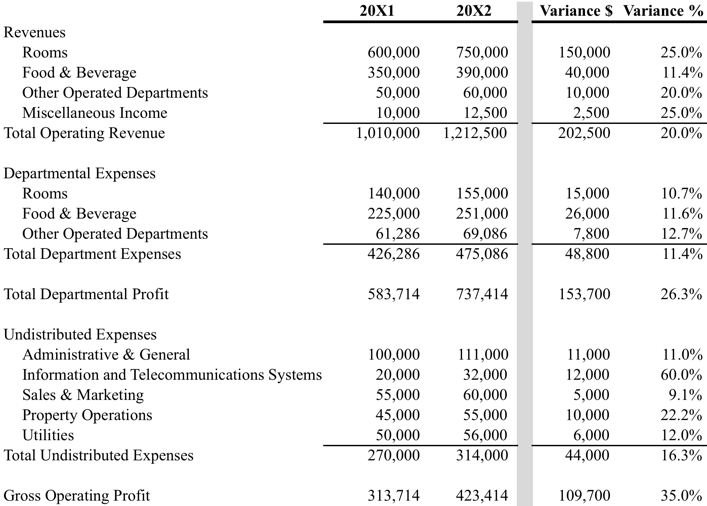
Examples: Horizontal Analyses of a Balance Sheet and Summary Operating Statement
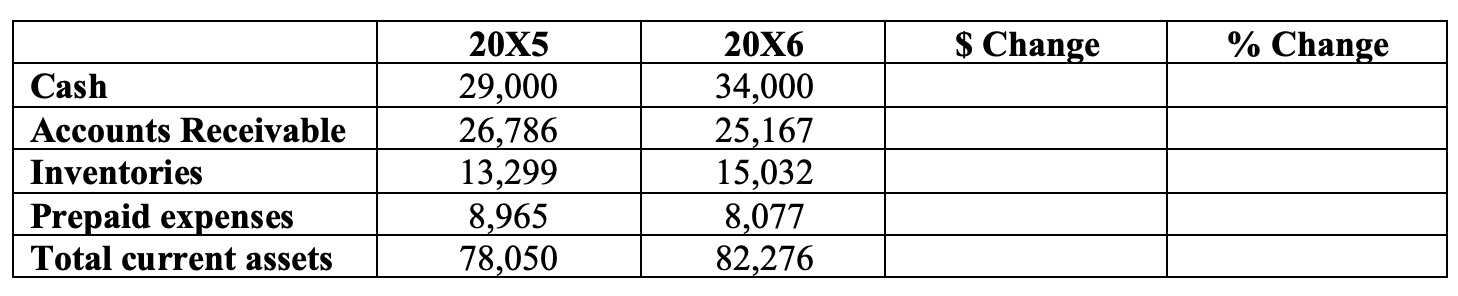
Exercises: Horizontal Analysis
Vertical Analysis
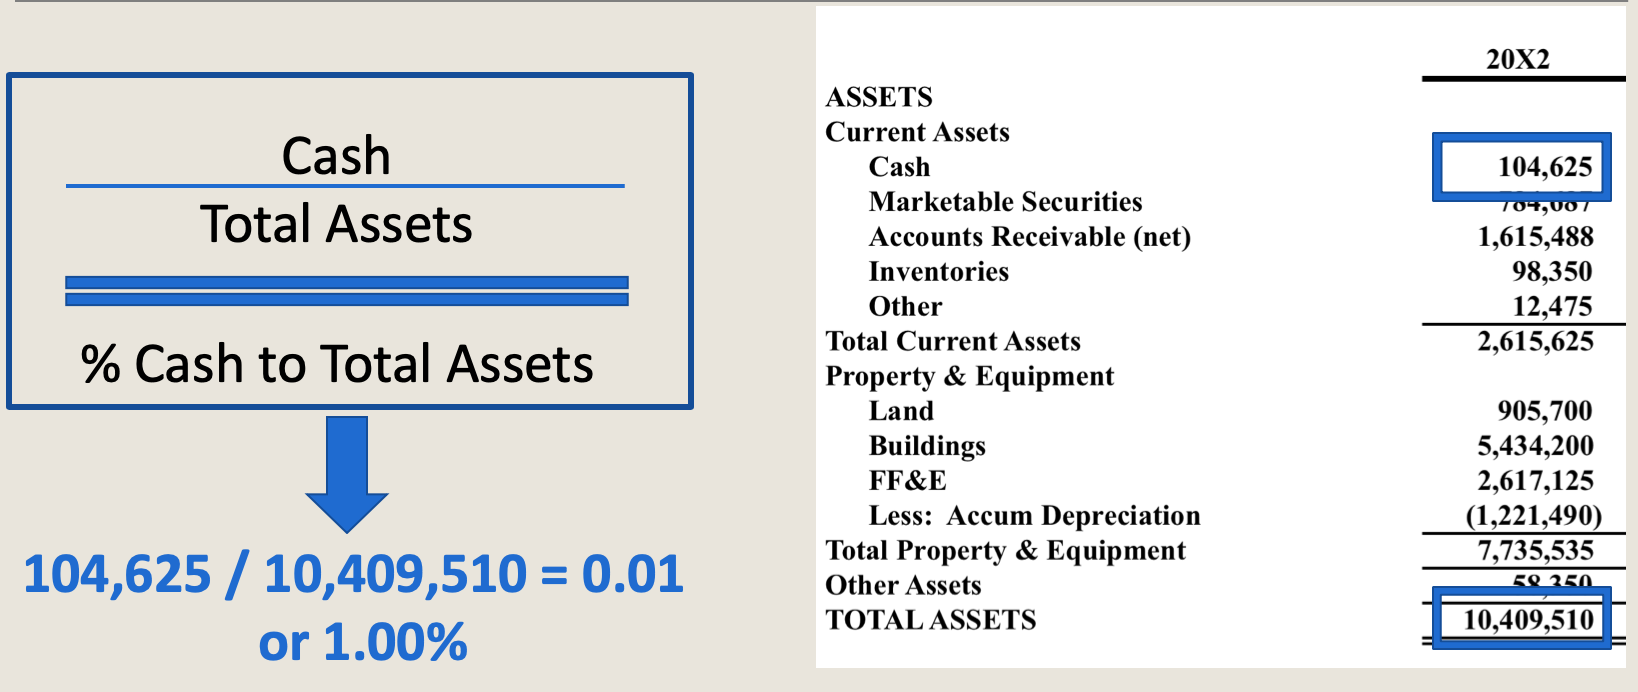
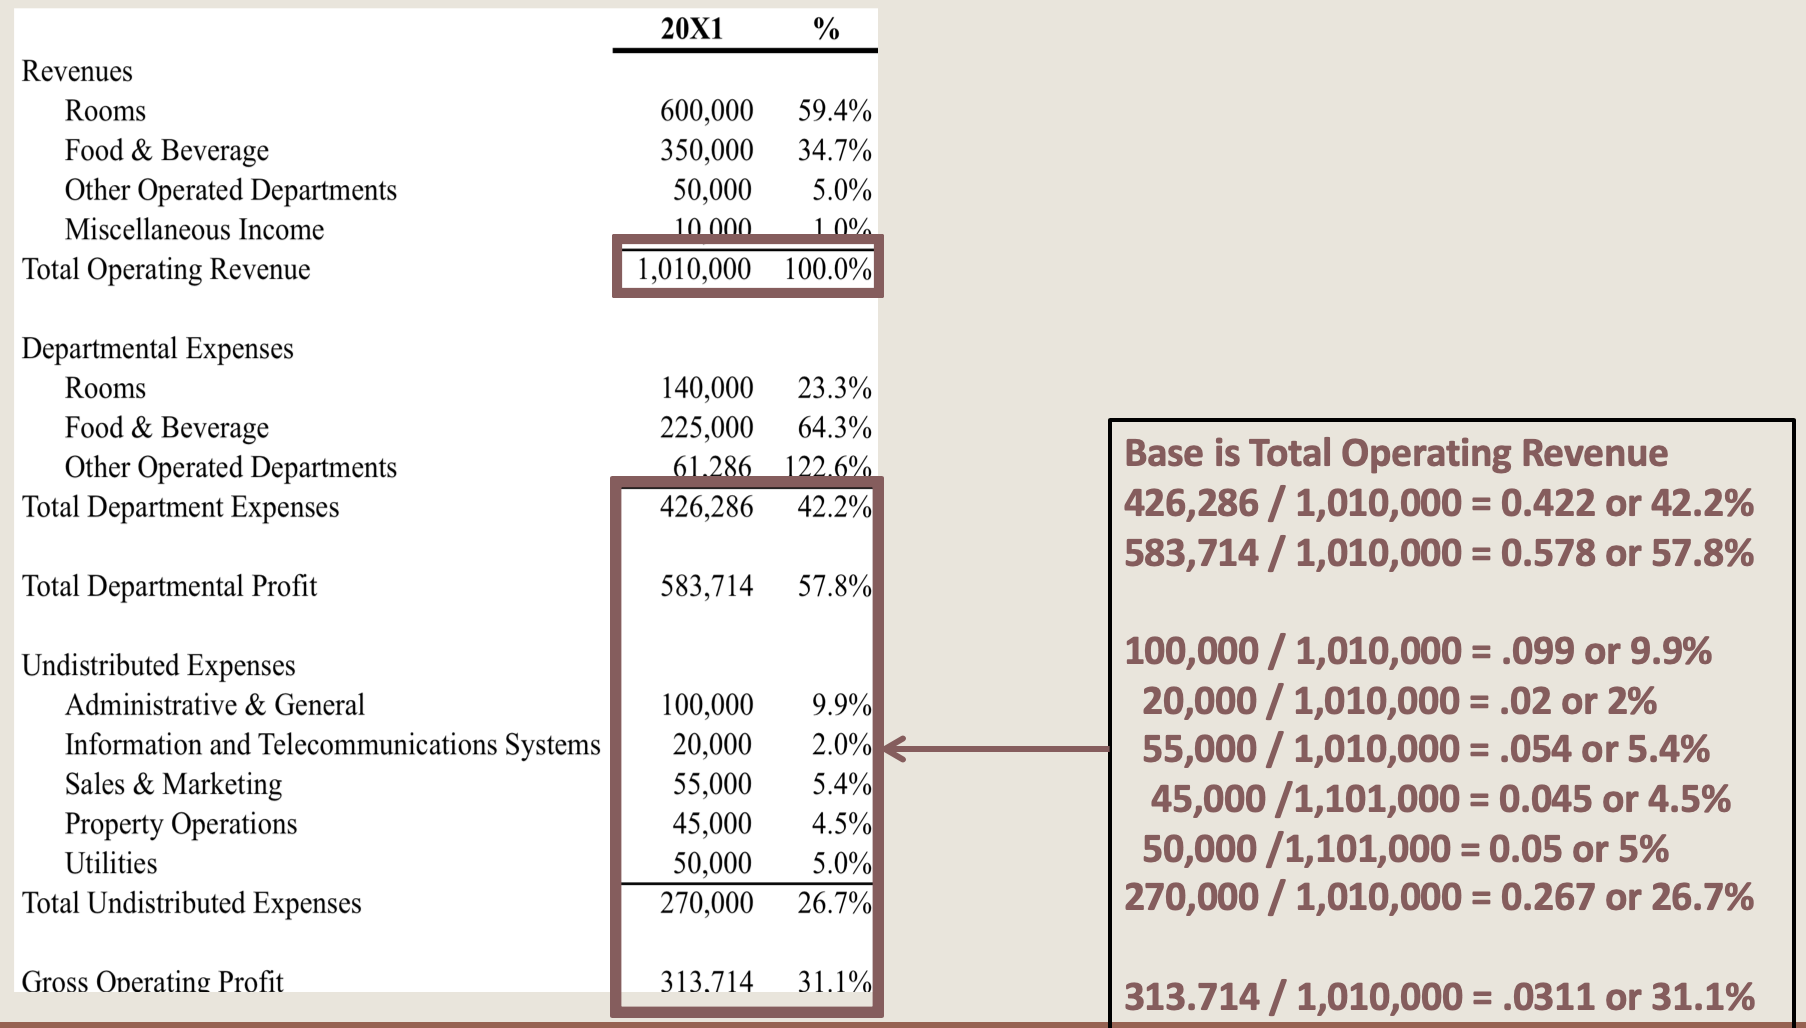
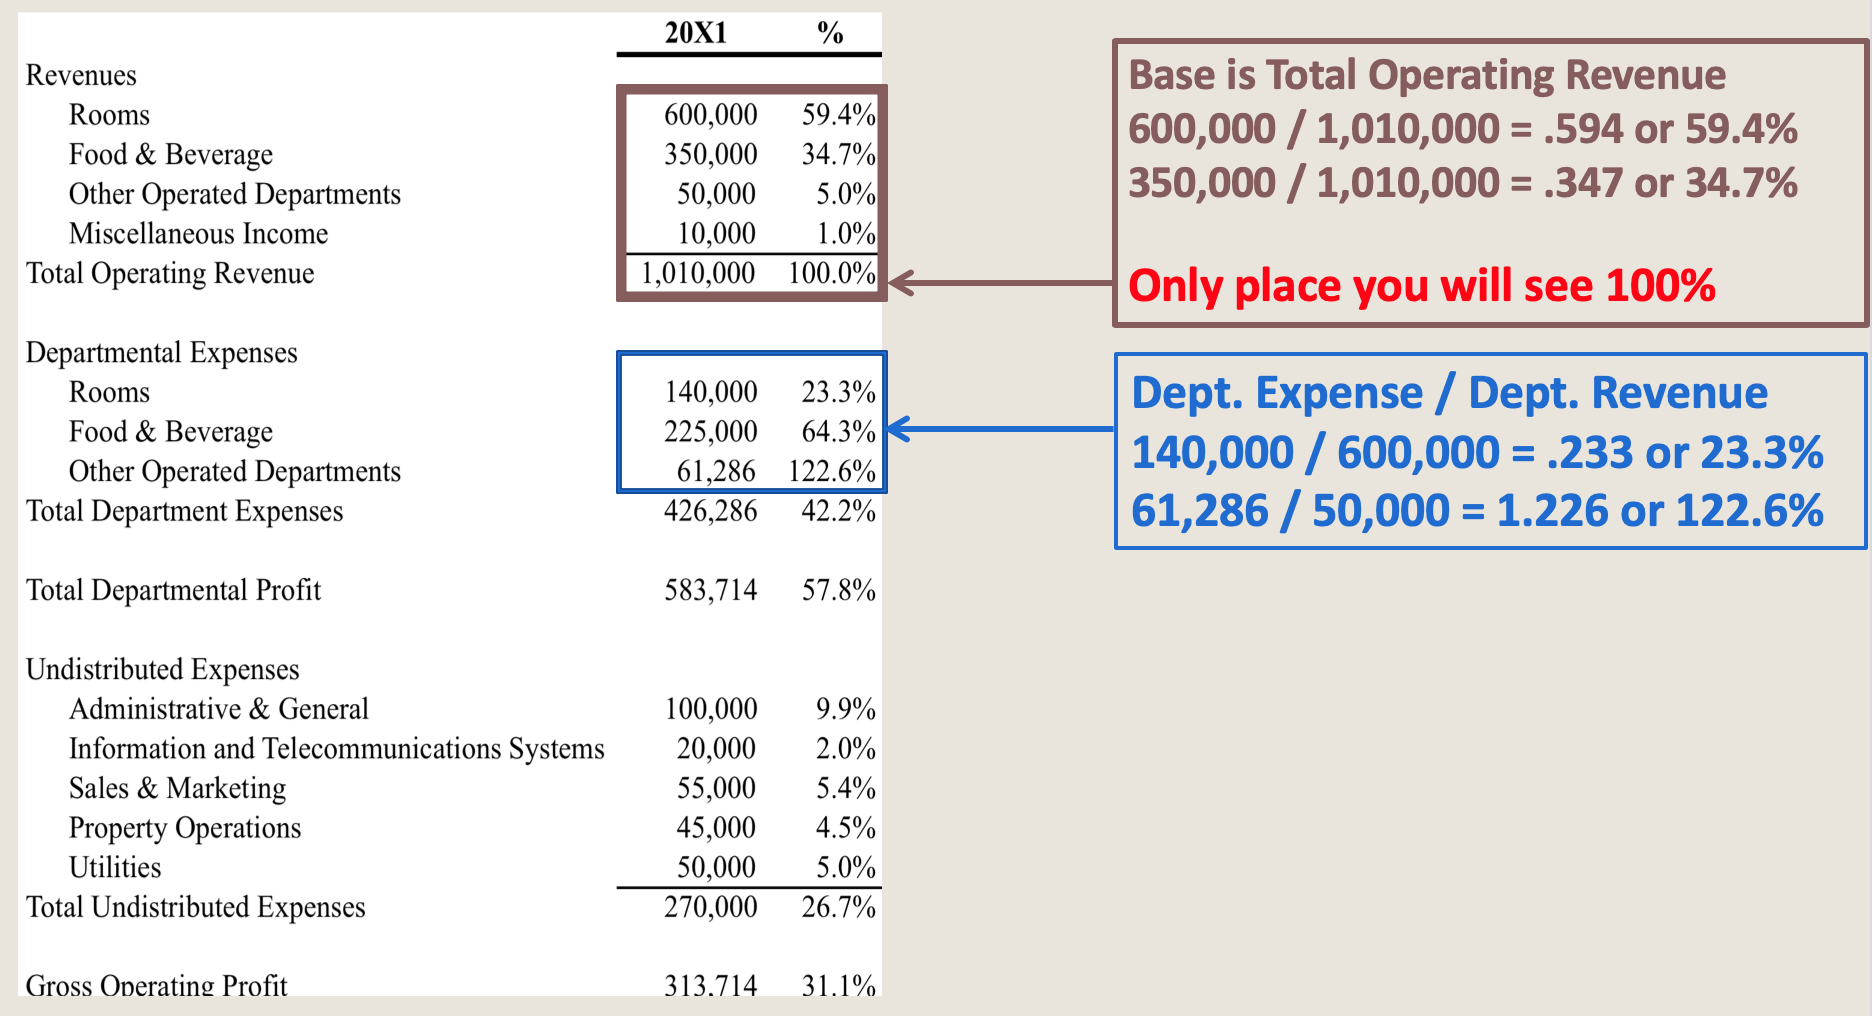
Vertical analysis is also called common size analysis, as the goal is to express each line-items as a % of a common base (thus the name common-size), where the base is always 100% and thus each line-item (or each account) makes up a percentage of the total. There is only one calculation for vertical analysis – calculating the % of each individual account or line-items to the base – but depending on the statement, the base is different.
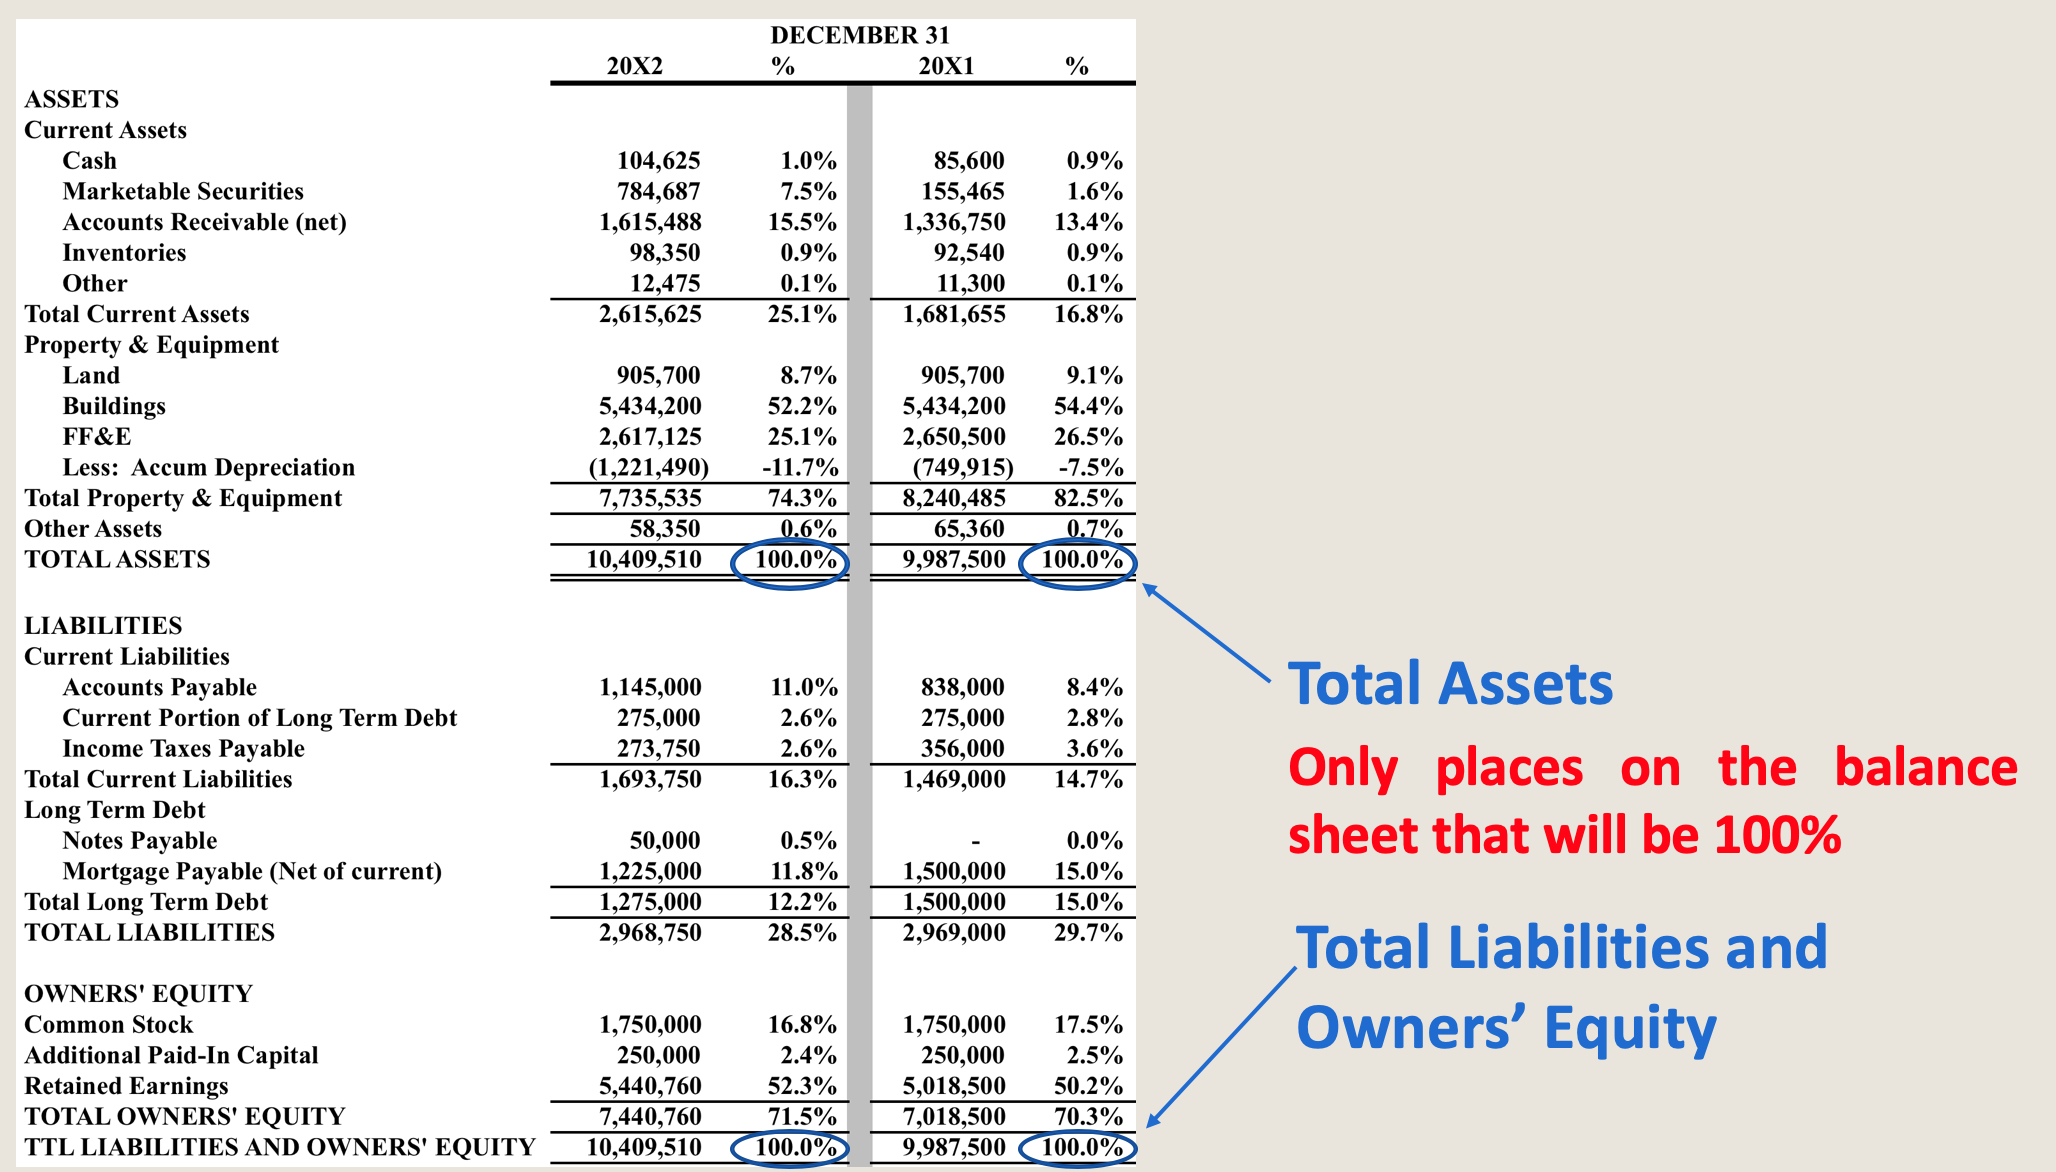
For an income statement, the base is always the total revenues. And, if net revenues is given, then use net revenues. The logic is that revenues is the total, the entire pie so to speak, and everything is part of the total, part of the pie. For a balance sheet, the base is always total assets as that is what and how the company is made up of, such as how much of the company is made up of current assets or long-term assets. Since A = L + OE, then of course total liabilities and owner’s equity added together is also the base as these two numbers (A and L+OE) equal each other.
Examples: Vertical Analysis
Examples: Vertical Analysis of an Income Statement (Summary Operating Statement)
Examples: Vertical Analysis of a Balance Sheet
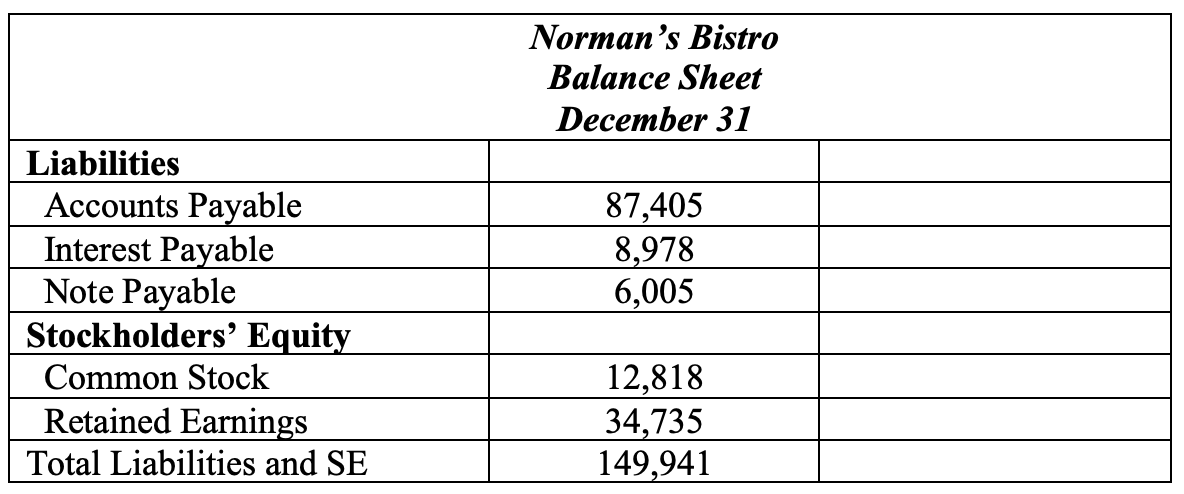
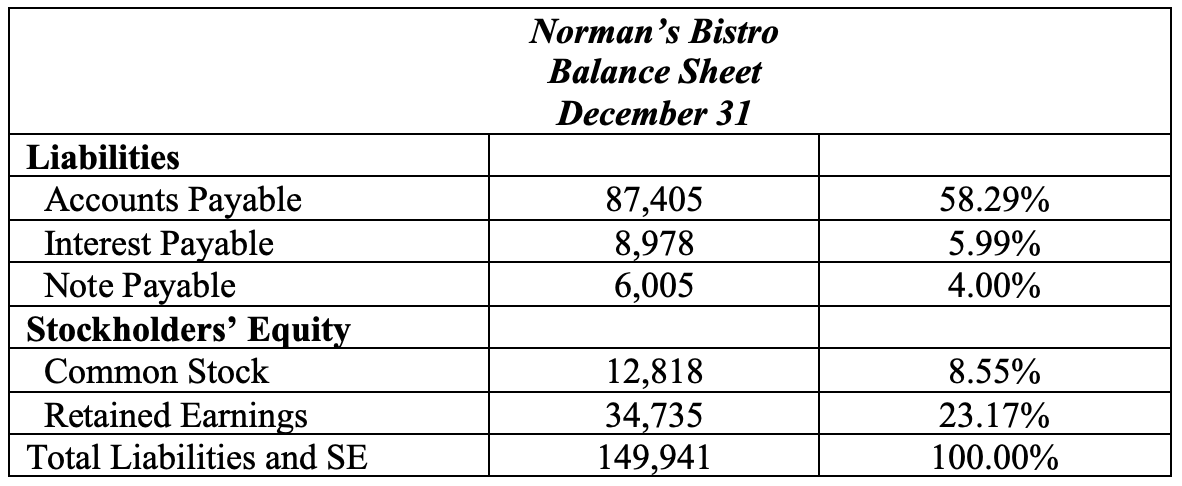
Exercises: Vertical Analysis for the Liabilities and Stockholders’ Equity
Ratios Analysis
Ratios express the relationship among “selected” items of financial statement data from the income statement, balance sheet, SCF, departmental statement, and others. They can be expressed in the forms of percentage (such as profit, labor cost, food cost, etc.), per unit (such as average check), turnover (such as seat turnover in a restaurant), or coverage (such as current ratio or times interest earned). All ratios are the results of one number divided by another. If the two numbers are from the same statement (e.g. both from the income statement and both from the balance sheet), you just need to divide the two numbers. However, if one of the numbers come from a period statement such as and income statement, and one is from a dated statement such as a balance sheet, then you will need to average the beginning and ending values of the balance sheet accounts before dividing the numbers. You will see such examples in the calculation of return on assets and return on equity later.
There are 5 major types of ratios:
- Liquidity
- Solvency
- Activity
- Profitability
- Operating
In this class, we will concentrate on liquidity, solvency, and profitability and you will learn the others in your managerial accounting class.
Liquidity Ratios
Liquidity ratios measure the short-term ability of a business to pay its obligations and meet unexpected needs for cash. The two liquidity ratios we will cover here are current ratio and acid-test ratio:
- Current = current assets/ current liabilities (rate or times) – this means for every dollar of CL you owe, you have $X in CA to pay for it, or to cover that debt.
- Acid-test or Quick = (cash + receivables)/current liabilities (rate or times) – this is very similar to current ratio as it also measures liquidity but it is more restrictive or conservative as it only uses cash and receivables as the numerator to over current liabilities and not the other current asset accounts.
Solvency Ratios
Solvency ratios measures the ability of a company to survive over a long period of time, paying or covering its debt for the long-term. Two solvency ratios will be covered in this class:
- Debt to Asset = total liabilities/ total assets (percentage) – from the formula, you can see that this measures how much of a percentage of a company (total assets – what the company has) is financed with debt. Every business will have some level of debt. A 40%-60% is average but if a company has a very high percentage, this can signify problems because the more debt a company has, the more interest it will have to pay back to its creditor on a regular basis, let alone paying back the principal of the loan or debt.
- Times interest earned (TIE) = Earnings Before Interest expense and income Tax (or EBIT) / interest expense (rate or times). This ratio indicates how many times you can pay off your interest with your earnings before interest and income tax. Interest and income tax are the last two items to be deducted before one derives the net income of a company. In this case, you would like this ratio to be high, meaning that the company is more than able to its interests. For example, if the ratio is 5, that means the company has resources to pay for or cover their interest obligations five times over.
Profitability Ratios
Profitability ratios measure the net income or operating success of a company for a given period. As mentioned earlier, if one of the numbers come from a period statement such as an income statement, and one is from a dated statement such as a balance sheet, then you will need to average the beginning and ending values of the balance sheet accounts before dividing the numbers. Three profitability ratios are covered below:
- Profit margin = net income / net sales – this tells for every dollar a company brings in as sales, the percentage that it is able to net in terms of income.
- Return on assets = net income / average assets – this tell us for every dollar a company invests in its assets, the percentage that it is able to net in terms of income. In this case, the assets needs to be the averaged number.
- Return on equity = net income / average equity – this tell us for every dollar a company invests in its equity, the percentage that it is able to net in terms of income. In this case, the equity needs to be the averaged number.
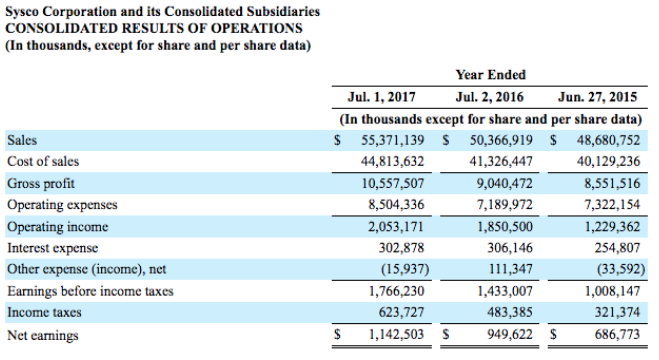
Examples: Ratios Analysis for SYSCO Corporation
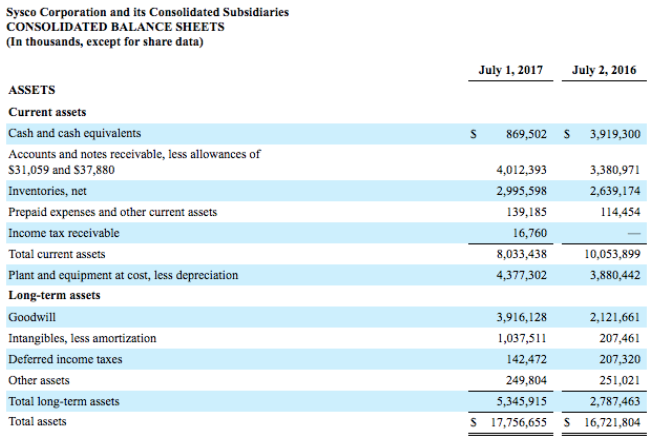
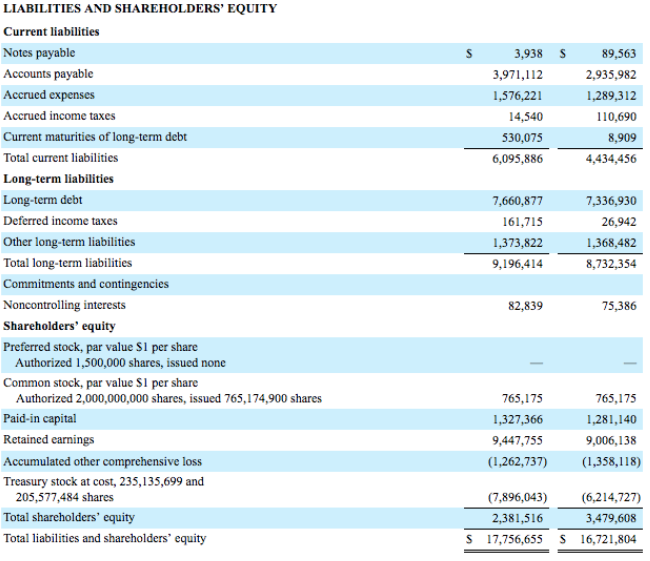
Please calculate the following ratios for 2017
Liquidity
- Current = current assets/current liabilities
- Current = 8,033,438/6,095,886
- Current = 1.32 times
- Acid-test or Quick = (cash + receivables)/current liabilities
- Acid test = (896,502 + 4,012,393)/6,095,886
- Acid test = .81 times
Solvency
- Debt to Asset = total liabilities/ total assets
- Debt to Asset = 15,292,300/17,756,655 [hint: make sure you add both current and long-term liabilities]
- Debt to Asset = 86.12%
- Times interest earned (TIE) =Earnings Before Interest expense and income Tax/interest expense
- TIE = 2,069,108/302,878 [hint: make sure you add net income + tax + interest as the numerator]
- TIE = 6.86 times
Profitability
- Profit Margin = net income/sales
- Profit margin = 1,142,503/55,371,139
- Profit margin = 2.06%
- ROA = net income/avg. assets
- ROA = 1,142,503/((17,756,655 + 16,721,804)/2)
- ROA = 6.63%
- ROE = net income/avg. equity
- ROE = 1,142,503/((2,381,516 + 3,479,608)/2)
- ROE = 38.99%
Summary
With the three tools of financial statement analysis, one can better understand the financial picture of a company, and therefore will be able to make better decisions for the operation.
