
8 Inventories and Cost of Goods Calculation
Learning Objectives
- Determine what are included in determining inventory quantities.
- Prepare the entries for purchases and sales of inventory under a periodic inventory system.
- Determine cost of goods sold under a periodic inventory system.
- Explain the basis of accounting for inventories, and describe the inventory cost-flow methods.
- Explain the financial statement and tax effects of each of the inventory cost-flow methods.
- Indicate the effects of inventory errors on financial statements.
Determining Inventory Quantities
Before discussing all the details of inventory and cost flows, let us first look at some basic terminology. Inventory is part of current assets and merchandise Inventory is inventory that is (1) owned by the company and (2) in a form ready for sale in the ordinary course of business. In our business, we only carry a small amount of inventory because we should not have a lot of food items in our storerooms, walk-ins, or freezers as we should keep our food as fresh as possible.
However, in manufacturing, inventory can even be further divided into:
- Finished Goods – inventory completed and ready for sale
- Work in Process – inventory in various stages of production/completion
- Raw Materials – inventory and components on hand waiting to be used in production
Therefore, managing inventory properly is a very important part of operating a good and successful business.
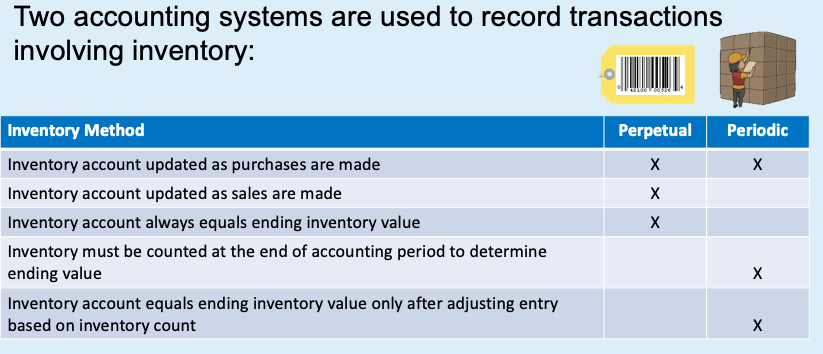
There are two major inventory systems. First, the perpetual inventory system. This means as soon as something is bought and sold, the business continuously update its inventory as purchases and sales are made. Obviously, this is not practical for most businesses and surely not for hospitality. Thus, we use the periodic inventory system where the inventory is adjusted at the end of a reporting cycle – hence our food cost and beverage costs adjustments that you have learned and mastered in Module 4. Below is a graphical comparison of the two inventory systems:
In determining what is the QUANTITY in inventory, there are a two steps one needs to include:
Step #1 – Take a Physical Inventory. This involves counting, weighing, or measuring each item of inventory on hand. The quantities of each inventory item counted is documented on the inventory summary sheet, and extended with the dollar amount.
Step #2 – Determining the Ownership of Goods. There are two terms that will help determine who owns the products. For everyday order of food or beverage, these terms are not applicable because the restaurant, or hotel, or club, does not own the food until the food is received at the back dock or in storage area. However, if a major hotel company is retrofitting or remodeling a number of its hotels and has ordered a large quantity of furniture and equipment to be shipped directly from the factory, then the term free on board or FOB will apply.
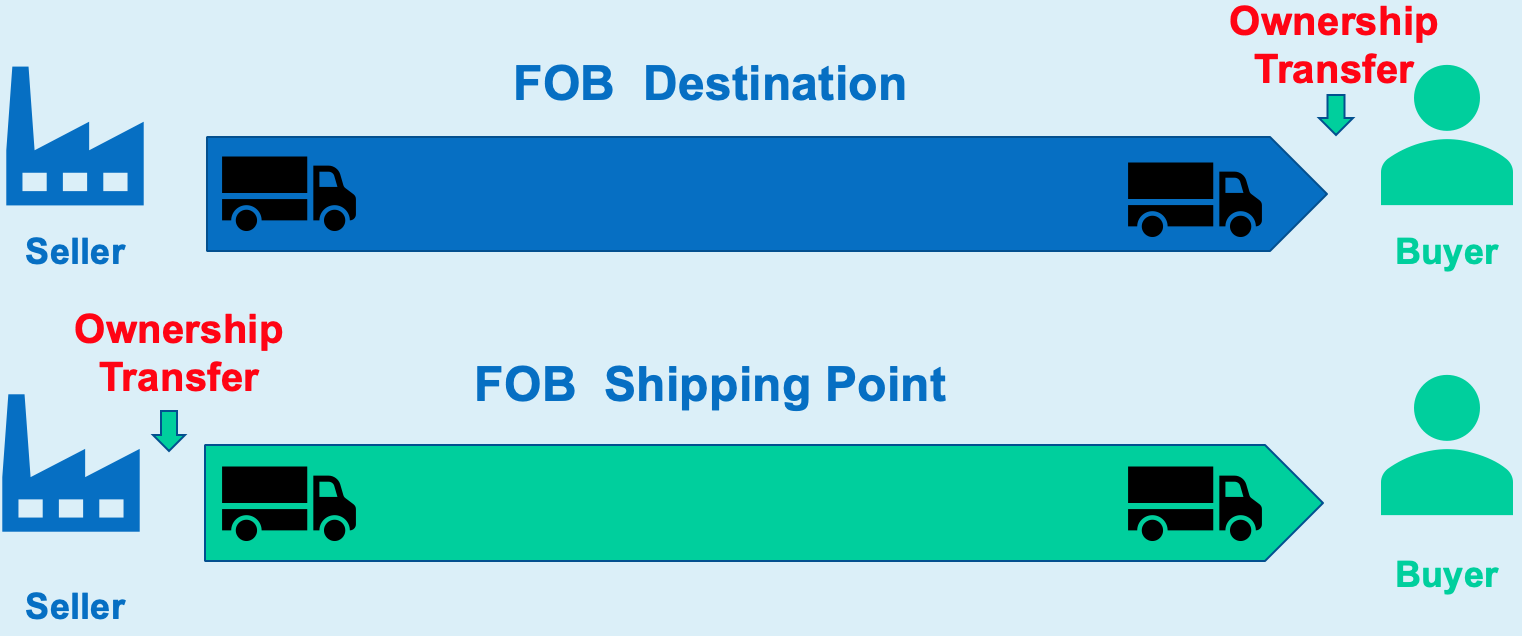
There are two FOBs. First, FOB Shipping Point means the ownership of the goods transfers to the buyer when goods are shipped. This may be in the US, or India, or China, or Germany – basically, anywhere. So, as the seller, you will want to use this option because if for some reason the goods are damaged during transit, it is not the your good anymore. However, as a buyer, you SHOULD NOT want this option as you do not want to take on the risk of receiving damaged products. Thus the second FOB is FOB Destination. This is when the ownership of the goods transfers to the buyer when the carrier delivers the goods to the buyer. Thus, as a buyer, you will want to use FOB Destination.
Key Takeaways: FOBs
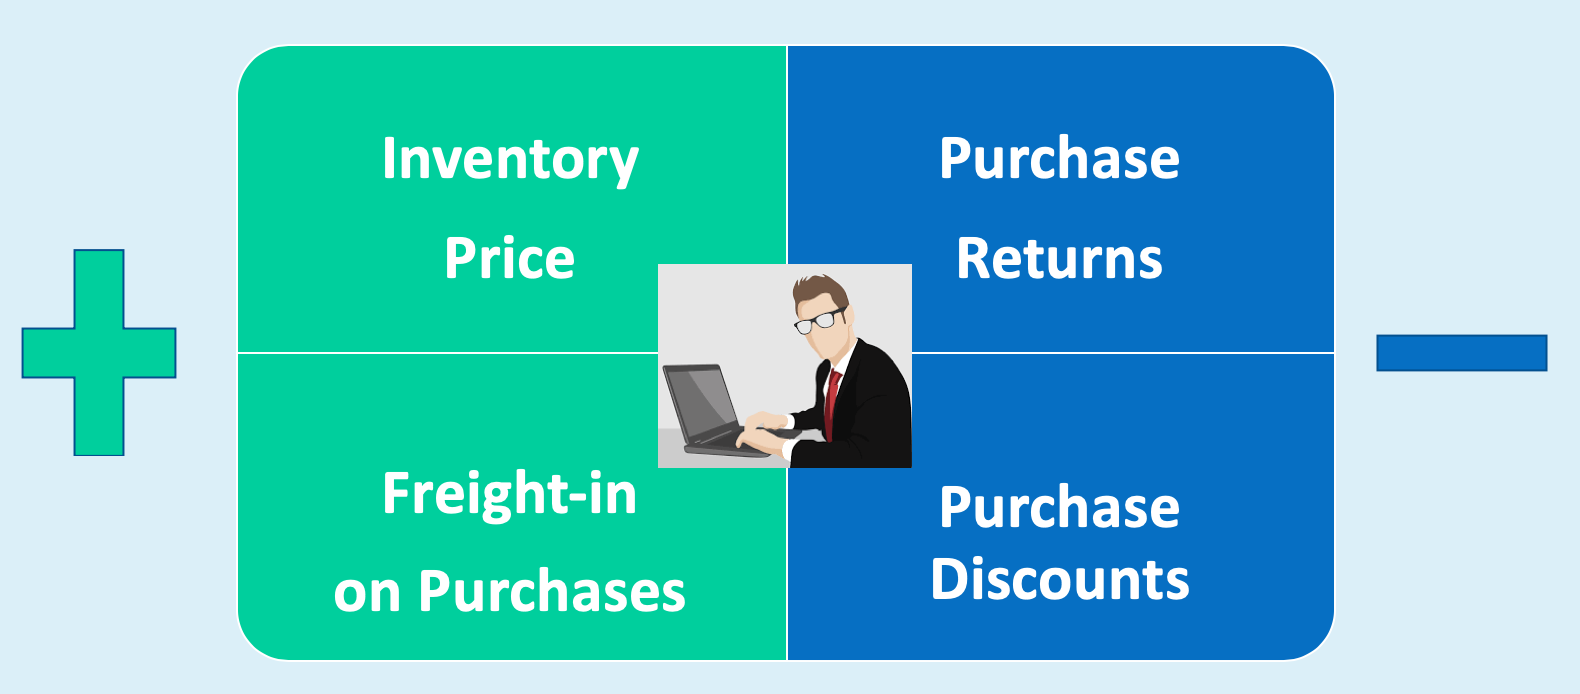
Once the quantity is determined, now, we can find the value or the dollar amount of the inventory. The formula for calculating the value of inventory is:
Value of inventory = Invoice Price + Freight-in on purchases – Purchase returns – Purchase discounts
Key Takeaways: Value of Inventory
Journal Entries for Purchases and Sales of Inventory (Periodic Inventory System)
By now, you have completed a good number of journal entries including adjustments and closing entries. Here we are putting two processes one after another and see what journal entries are needed to record them. The first process is when you as the business buy food or any inventory and then pay your vendors. The second process is when you as the business sell these inventory items to your customers and then receive the payments from your customers.
Recording Purchases and Payments of Merchandise/Food/Services
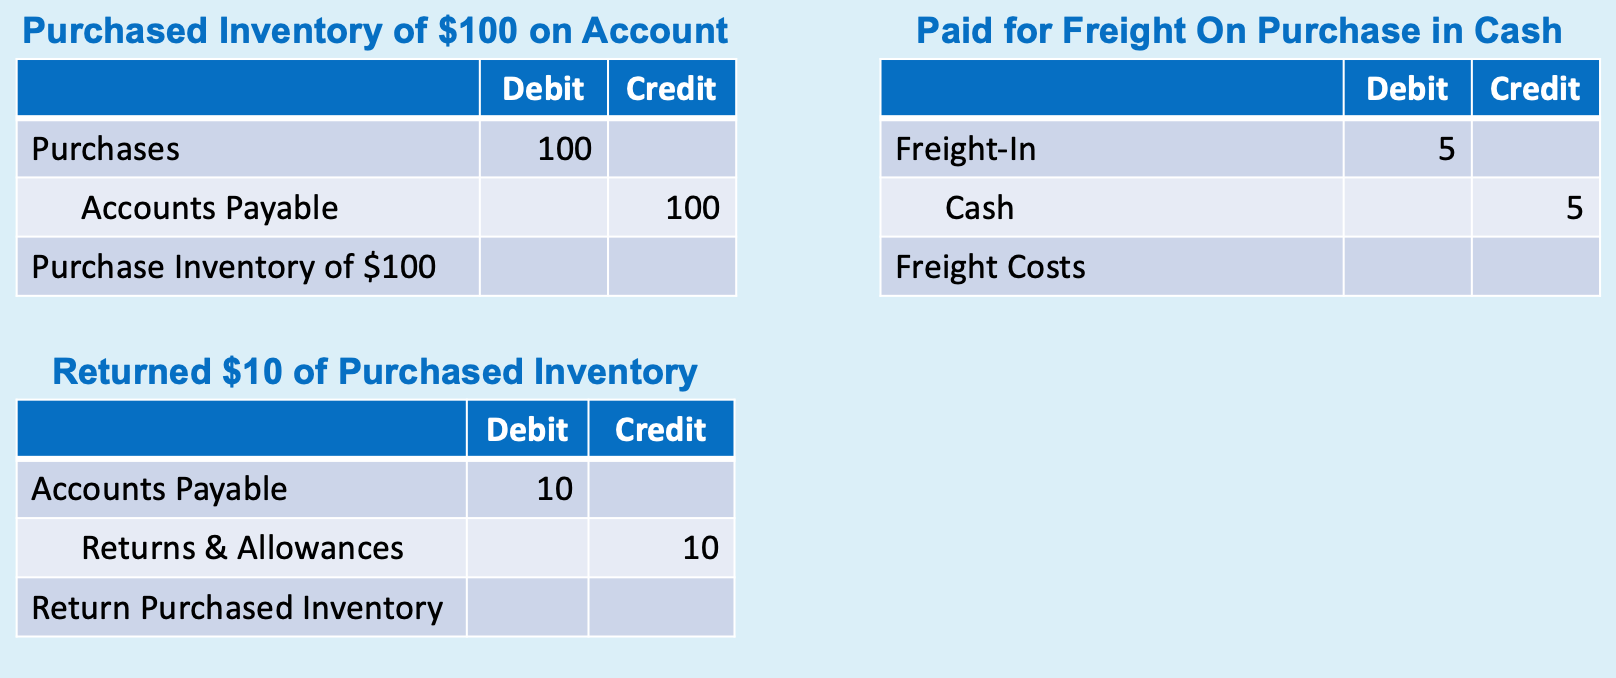
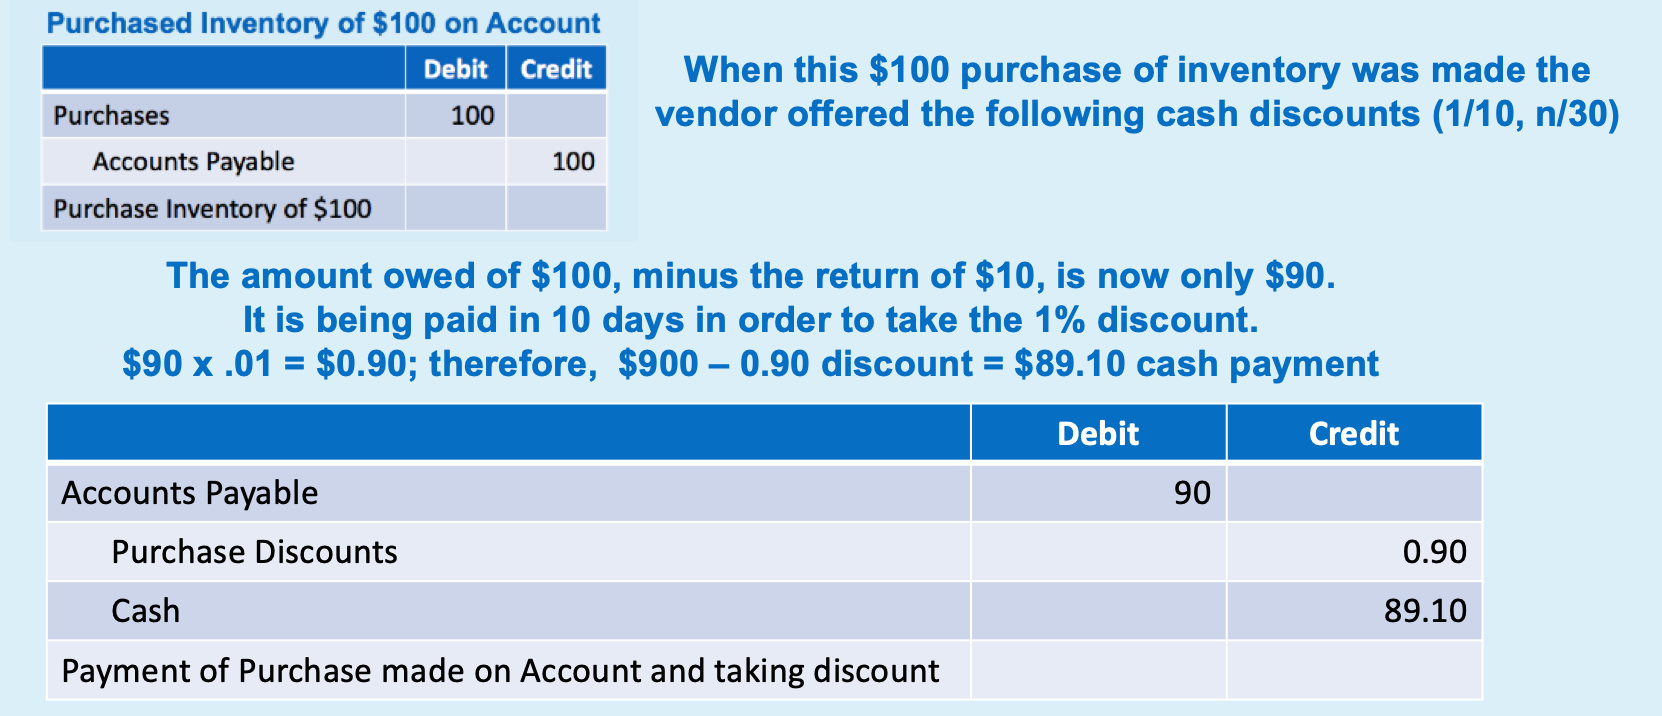
Here, to make it simple, assume you are the manager of a country club and we just called the purchase you made “purchases”. Obviously, if it is food, you should have used “food inventory”, if it is beverages, then “beverage inventory” etc. And, since it was bought on account, you debited purchases and credit accounts payable with the explanation “purchase inventory of $100”. But once your chef opened the boxes, she found that some of the food items were not up to par, so you called up the vendor and you told the vendor that you are returning $10 of the purchases to them. And, in this particular purchase, you are also charged a $5 fee for freight. The appropriate journal entries are as follow:
In this example, this particular vendor also offers purchase discounts. Purchase discounts are given as an incentive so you, the buyer, will pay the vendor early. This helps with the cash flow of the vendor, the seller. If these discounts are taken by you the buyer, the vendor will be able to collect their money earlier. In order to entice you the buyer to pay early, the vendor in this example is offering its clients terms of (1/10, n/30). The “1/10” means you, the buyer, will get a 1% discount on what you owe if you pay within the first 10 days of the invoice; if not, the net amount is due in 30 days, hence “n/30”. So, if a purchase discount is taken, then 1% of what you owe $90 = $0.90, will be deducted from that total amount owed. Remember, although you bought $100, you returned $10, so you only owe $90.
The terms of purchase discounts are often written in the form of “a/b, x/y” where:
- a = % discount offered
- b = number of days discount is valid
- x = is normally the amount, thus “n” for net, and
- y = final due date before a late fee or penalty is charged
So, a 1/15, n/EOM means 1% off if paid within the first 15 days of invoice, and the full amount is due end of month.
Recording Sales and Payments of Merchandise/Food/Services
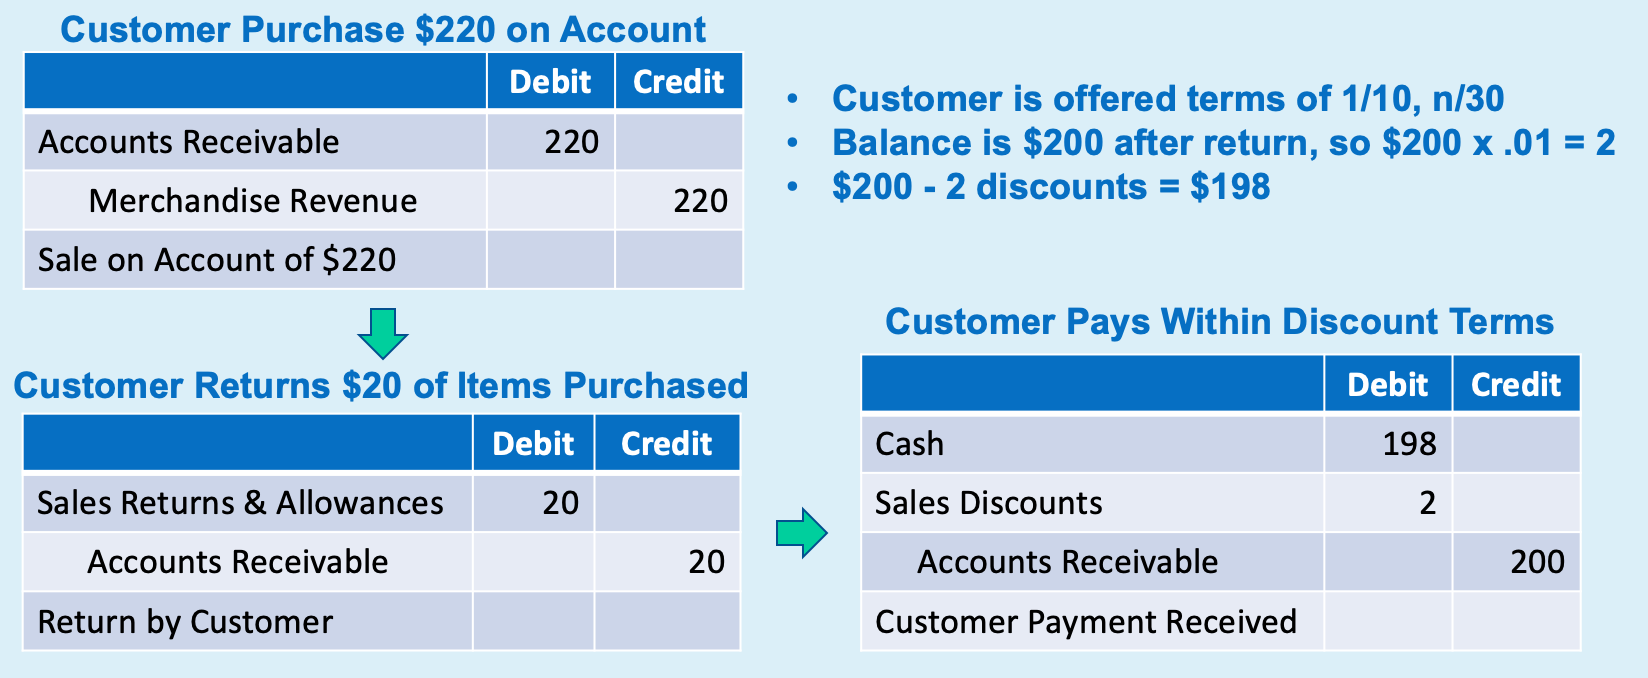
Now that you have purchased some inventory, you made a sale to your client. And in this example, it is a credit sale of $220. Since you have not received the cash, you debited accounts receivable and credited revenues. You also offer terms of 1/10, n/30. Since you are now the seller, this is now called a “sales discount”.
In the meantime, something was wrong with your products and your client returned $20 worth of product. So, you debited sales returns and allowances and credited accounts receivable. Note that when you credited accounts receivable of $20, the amount that this client owes you becomes $200 ($220 – $20).
This client also wants to take advantage of the discount, so she pays within 10 days of the invoice date. Since she owe you $200, 1% of $200 is $2. And, so she only writes you a check of $198 ($200 – $2). When you receive the her check, you debited cash of $198, recognized the sales discount of $2, and cleared out her account by crediting accounts receivable.
Inventory Cost of Goods Calculations
In the vertical (common size) analysis, you may recall that in an income statement, the common base is sales (or revenues) for all accounts except the cost accounts. In food cost calculation and beverage cost calculation, food cost and beverage cost are divided into food sales and beverage sales respectively rather than lumping all costs together to be divided by total sales. The formulas therefore are as follow:
Food Cost % = Cost of Food Sold / Food Sales
Beverage Cost % = Cost of Beverage Sold / Beverage Sales
The reason behind this treatment are various. Beverages in our business does not mean water, sodas, iced-tea, or juice; beverages are “alcoholic beverage” – liquor, beer, and wine. The first reason why we do not divide food cost and beverage cost by total sales is that food and beverage have different cost structures. What we mean by that is food and beverage are priced differently. Food cost can run from mid 20% to even 50% plus but beverage costs are normally much lower. A bottle of wine at a grocery store may only cost $10 but if purchased at a restaurant, it can be priced at $60 plus.
Second, food and beverage also contribute differently to a business in terms of sales. Most food outlets will sell more food rather than beverages. Most bars or beverage alone operations will sell more beverages than food.
Third, alcoholic and beverage commissions levy taxes on alcoholic beverages so these sales need to be tallied separately. For these and other reasons, food cost is always calculated over food sales, and beverage cost, beverage sales.
Inventory Cost Flow Methods and Calculations
The Methods
There are four cost flow methods: specific identification, first-in first out, last-in first out, and weighted average.
Specific Identification tracks the actual physical flow of the goods as they are purchased and sold. Each item is marked, tagged or coded. This method is the most accurate for recording inventory and cost of goods sold. However, it is often impractical. While you will not see it in our industry, for businesses that sells high priced item (car dealership, jewelry store), specification identification is used.
First-in, first-out (FIFO) assumes the earliest (oldest) goods purchased are the first to be sold. This method often parallels the actual physical flow of merchandise, and the ending inventory calculation is therefore based on the latest units purchased since those should be the ones that are left and not sold as yet.
On the other end, Last-in, first-out (LIFO) assumes the latest (most recent) goods purchased are the first to be sold. This method rarely coincides with the actual physical flow of merchandise in our business as the ending inventory calculation is based on the oldest units purchased. Just imagine – the oldest food is the ending inventory! Therefore, this is not normally used in hospitality.
The last method is weighted average cost or weighted average. This method assumes the goods available for sale have the same cost per unit. The cost of good sold (COGS) therefore is calculated by multiplying the average cost by the number of units sold, and the ending inventory is calculated by multiplying the average cost by the number of units on hand at the end of the accounting period. In other words,
- Weighted average unit cost = total cost of goods available for sale / total quantity available for sale
It is perfectly legal for a business to use any of these inventory cost flow method to cost out their inventory, while in practice, they may be doing something else. For instance, it makes sense for a hotel to use FIFO but their employees are simply grabbing items from the storerooms to use and do not rotate the stock properly and take the oldest inventory first. However, it is not acceptable that a business went with one method one year and then changed to another one, then a third one the next year, and then reverted back to the first method. If so, this business will be violating the consistency principle! Let’s take a look at an example calculation.
The Calculations
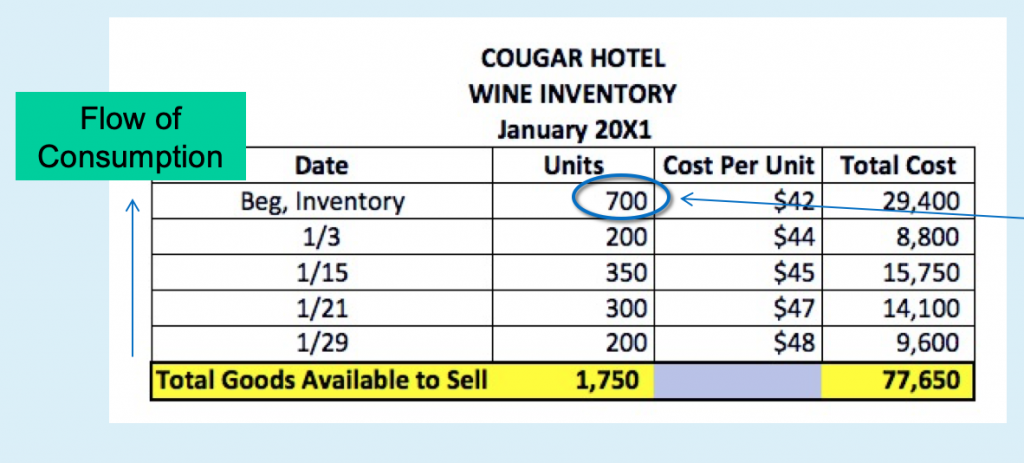
Cougar Hotel has a small wine inventory. On January 1, it was noted that 700 bottles were in the storeroom, and the cost for each bottle is $42. Therefore, the total cost was 700 x $42 = $29,400. During the month of January, it purchased 4 more lots of wine and thus it has a total inventory amount of 1,750 bottles. For instance, on January 3, 200 bottles were purchased and the per bottle cost was $44, thus a total cost of $8,800 is found in the total cost column. At the end of the month on January 31, when the manager counted all the bottles left in the storeroom, instead of the total of 1,750, only 500 bottles were left.
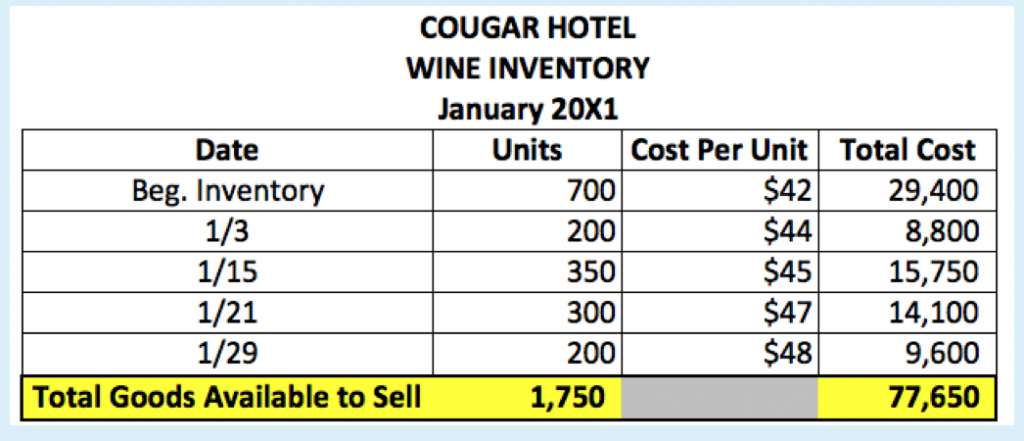
Using FIFO, LIFO and weighted average, calculate the ending inventory, cost of beverage sold, and gross profit for each inventory cost flow method if Cougar Hotel is selling this wine at $60 a bottle. [Again, these numbers are purposely set at a small amount for demonstration purpose. If a bottle of wine costs $42, rest assured foodservice places will be selling it for way more than the $60 used in this example.]
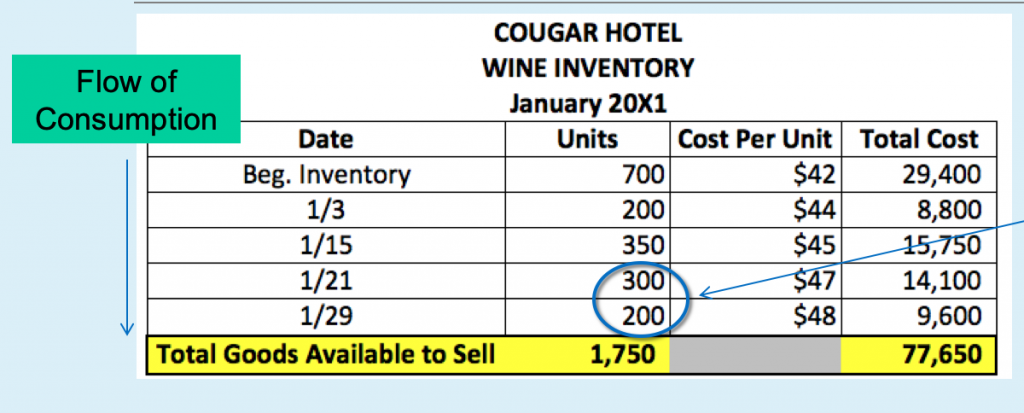
FIFO – if FIFO (first-in, first-out) is used, then what remains or is left over can be found the lots that are purchased most recently. The last purchase had 200 bottles, but that is not enough to make up the 500 bottles that are left in the inventory. So, you will start from the bottom, and take all the units until you reach the ending inventory of 500. In this case, you started with the 200 so you need 300 more to make it to 500. It is just lucky that the next purchase is exactly 300. So, you take these 500 bottles and their costs and that is the answer for the ending inventory. In this case, 300 bottles x $47 = $14,100, and 200 bottles x $48 = $9,600. Thus, the ending inventory under the FIFO method is $23,700 ($14,100 + $9,600).
To then calculate the cost of beverage sold, there are two ways. The easiest way is that if your total inventory of 1,750 bottles is worth $77,650, and that your ending inventory is $23,700, then take the difference of the two and you will get cost of beverage sold as $53,950. Inventory is either sold or left over, so these numbers should totaled up nicely.
The second way is that if you know you have only 500 bottles left, that means you have sold 1,250 bottles. Since this is FIFO, you will start from the top to start selling until you reach 1,250 bottle and the find the corresponding costs and add them up. This is of course a much longer method with more calculations and thus more chance for mistakes. However, if you love numbers, you can do both methods to check your answers!
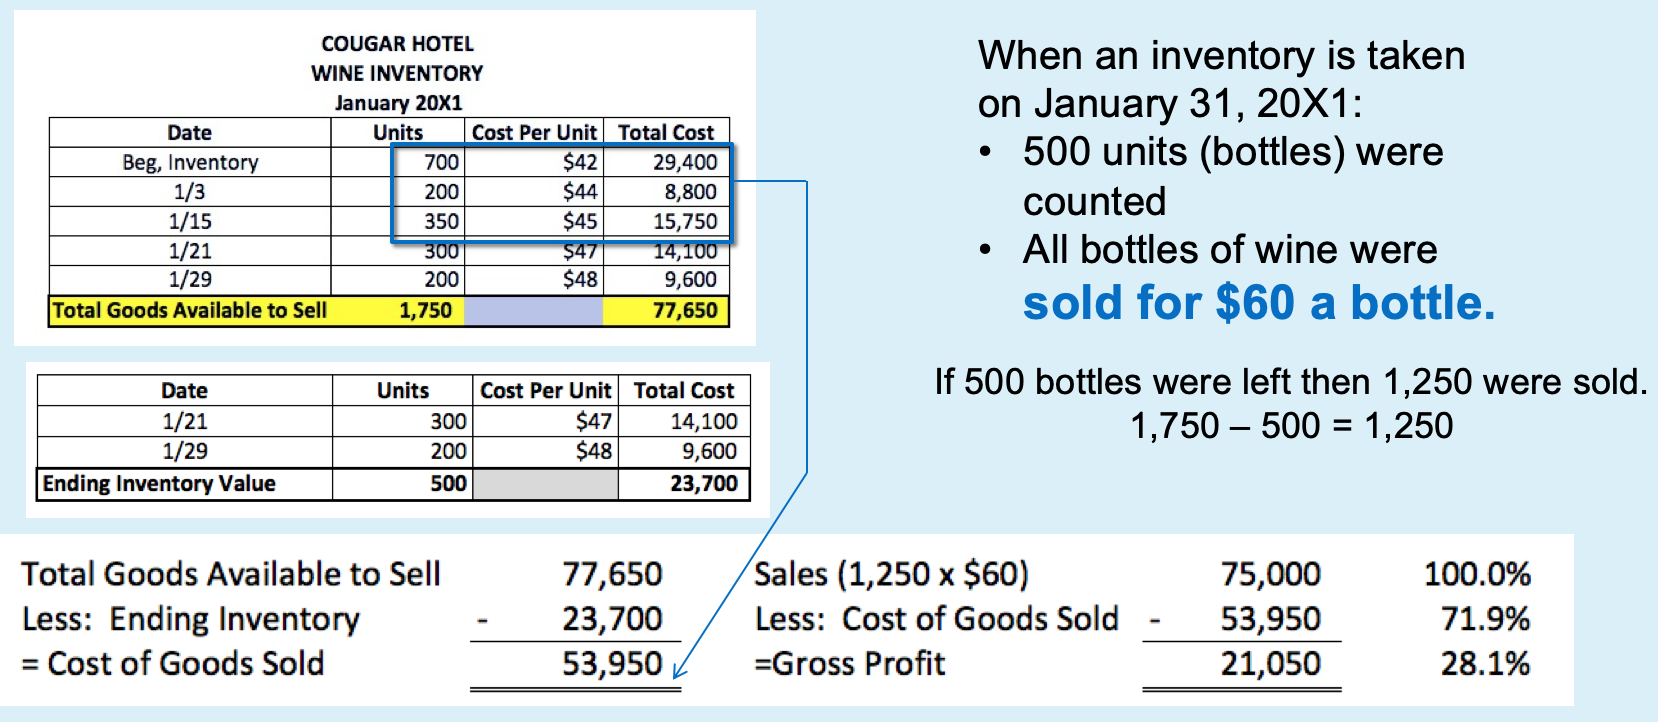
As for the gross profit, recall from Module 6 that revenues – cost of goods sold = gross profit. So, in this example, Cougar Hotel sold 1,250 bottles at $60, collecting revenues of $70,000. With a cost of beverage sold of $53,950, its gross profit is therefore, $21,050 ($70,000 – $53, 950).
LIFO – if LIFO is used (last-in, first-out), then what remains will be in the lots that are the oldest – from the beginning inventory. Cougar Hotel has 700 bottles in the beginning inventory and you only need 500 since the ending inventory is only 500. Thus, 500 bottles at $42 per bottle, $21,000 is the value of the ending inventory under the LIFO method. Again, you only need to get to the 500 bottles, no more, no less.
To calculate the cost of beverage sold under LIFO, once again, take the value of your total inventory of 1,750 bottles of $77,650, and minus the ending inventory of $21,000, you will get cost of beverage sold as $56,650. You can also try the second method just to check the figures. Since you took 500 bottles from the beginning inventory and that is your leftover, that means the other 200 bottles and all the purchases have been sold. Multiply all these bottles sold, all 1,250 of them to their corresponding costs, you will also come to the same conclusion, that the cost of beverage sold is $56,650.
As for the gross profit under LIFO, subtract the cost of beverage sold of $56,560 from the revenues of selling those 1,250 bottles at $60 (or $70,000), the gross profit under the LIFO method is therefore, $21,050.
Weighted Average Cost – according to the formula, the per bottle weighted average unit cost = total cost of goods available for sale / total quantity available for sale. The total cost of beverage available for sale is $77,650 and the total quantity available is 1,750 bottles. Therefore the weighted average cost per bottle is $77650/1,750 or $44.37 per bottle.
Please note that adding up all the unit costs of $42, $44, 45, $47, and $48 and dividing that by 5 is NOT the “weighted” average. That is a simple average. No weights were included. By multiplying each cost by the bottles (weight) associated with each cost, and then use that number ($77, 650) to be divided by the total bottles of 1,750, that is “weighted”. So please DO NOT just add the costs alone and average them out.
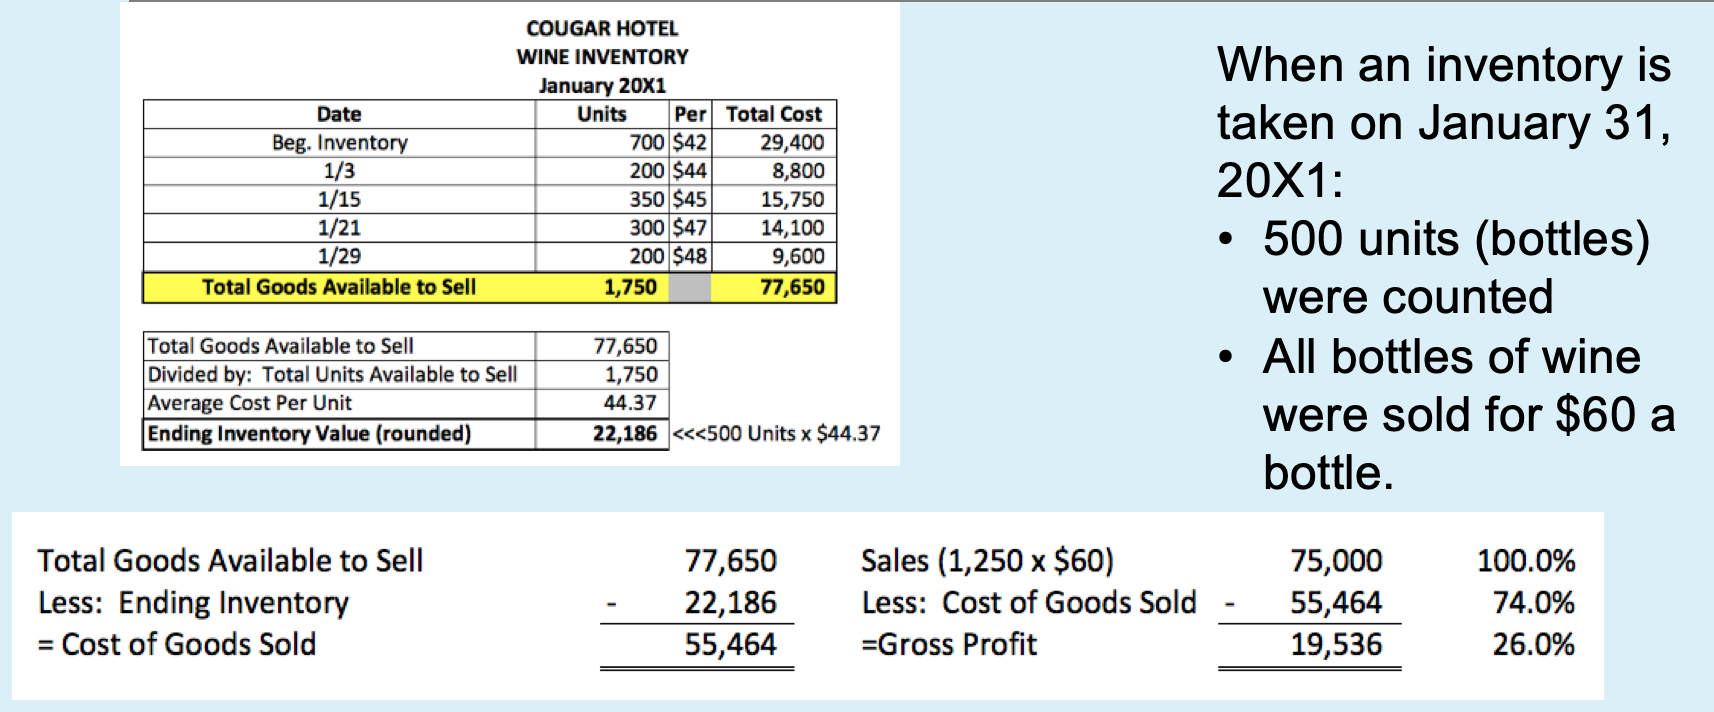
But $44.37 is only the per bottle cost. So, the ending inventory will be $44.37 x 500 bottles or $22,186. Following the same methods used above, the cost of beverage sold therefore is $77,650 – $22, 186 = $55,464; and the gross profit is $75,000 – $55,464 = $19, 536.
Financial Statement and Tax Effects
Obviously, depending on which of the three methods a business uses, the effects of these calculations will be different on the business. Take a look at the answers from all three methods:
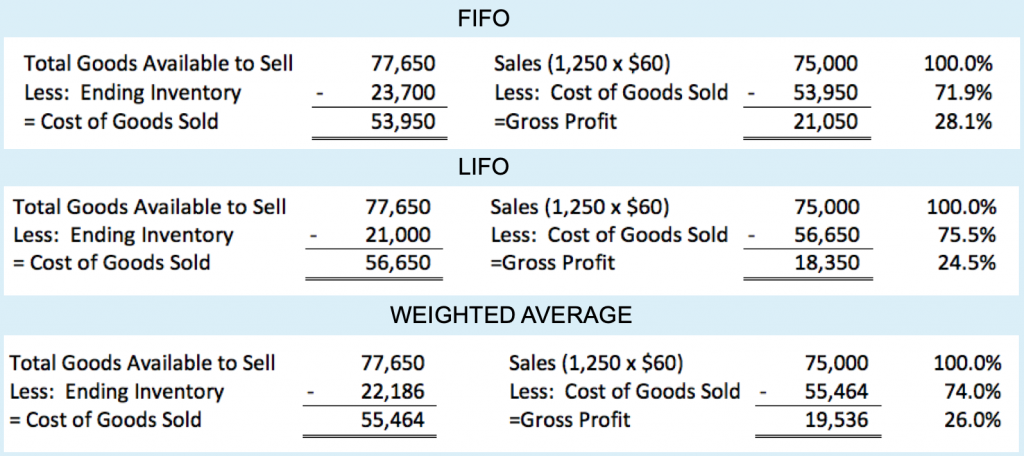
During times of inflation, when prices keep on going higher and higher (as in this example $42, $44, 45, $47, and $48), FIFO has the lowest cost ($53,950). This is because the oldest inventory, with the lowest costs, is sold first. The inventory left is at the higher cost level and is valued at approximate replacement cost. With the highest inventory value amongst the three methods, the effect on the balance sheet will show the business has more asset. With the lowest cost, the effect on the income statement would be higher taxable income, and the business will pay more tax.
On the other hand, during times of inflation, LIFO produces the highest costs since the newest inventory with the highest cost is sold first. The inventory left is at the lower cost level. With the lowest inventory value amongst the three methods, the effect on the balance sheet will show the business has less asset. With the highest cost of beverage sold, the effect on the income statement would be a lower taxable income, and the business will pay less tax.
The weighted average cost method always produces a result in the middle between FIFO and LIFO.
During times of deflation, when prices keep on dropping, the exact opposite is true. FIFO will have the highest cost and thus the lowest profit, the lowest taxable income and business will pay less tax. And, LIFO will now have the lowest cost, thus the highest profit, highest taxable income, and business will pay more tax. Again, the weighted average cost method produces numbers that are between the two methods of LIFO and FIFO.
Effects of Inventory Errors on Financial Statements
As mentioned above, different inventory cost flow methods yield different effects on the balance sheet and the income statement in times of inflation and deflation. In general, FIFO costs allocated to ending inventory will be close to their current cost, while LIFO costs allocated to ending inventory may be understated when compared to current cost. At the end, which method (FIFO, LIFO, average, etc.) a company selects is up to the company! However, do remember to observe the guidelines of GAAP and do not let the temptation of paying less taxes in a particular year dictates which method you should use to value your inventory.
Examples: Cost Flow Methods
The following is information on a special menu item for the Pacific Steakhouse. The beef is flown by air to the restaurant from Japan once a week. Below are the inventory amounts for this special beef for the month of March 20xx. Each pound of beef was sold for $100. A physical inventory on March 31 revealed that 65 pounds are on hand. Please calculate the value of the ending inventory, cost of food sold, and gross profit using FIFO, LIFO, and weighted average methods.
| 3/1 | Beginning Inventory | 10 x | $85.00 = | $ 850 |
| 3/7 | Purchase | 40 x | $88.00 = | $3,520 |
| 3/14 | Purchase | 60 x | $90.25 = | $5,415 |
| 3/21 | Purchase | 75 x | $93.75 = | $7,031.25 |
| 3/28 | Purchase | 80 x | $98.00 = | $7,840 |
To set up the problem, first calculate the total pounds of beef available and the total value of all the beef. This will also be a big help when you are ready to calculate the weighted average cost.
- Total pound available = 10 + 40 + 60 + 75 + 80 = 265 pounds
2. Total value = $850 + $3, 520 + $5,415 + $7,031,25 + $7,840 = $24,656.25
3. Total sold = 265 (total available) – 65 (left over) = 200
4. Calculations:
| FIFO | LIFO | Weighted Average | |
| Ending
Inventory |
65 x $98 = $6370 | 10 x $85 = $850
40 x $88 = $3520 15 x $90.25 = $1353.75 850+3520+1353.75 = $5723.75 |
24,656.25/265 = $93.04
65 x $93.04 = $6047.60
|
| COFS
|
$24,656.25
– $6370.00 = $18,286.25 |
$24,656.25
– $5723.75 = $18,932.50 |
$24,656.25
– $6047.60 = $18,608.65 |
| Gross Profit | 200 x $100 = 20,000
20,000 – $18,283.25 = $1,719.75 |
200 x $100 = 20,000
20,000 – $18,932.50 = $1,067.5 |
200 x $100 = 20,000
20,000 – $18,608.65 = $1,391.35 |