
Chapter 1: Introduction to Science and Geology
Scientific Method, Maps, and Density
This book contains exercises for a physical geology lab class. It is under development, with a full 1st edition release planned for Fall 2024.
Learning Objectives
The goals of this chapter are to:
- Get to know your classmates
- Use the scientific method as practiced by geologists
- Review accuracy, precision, and extrapolation of data
- Recognize map fundamentals
- Understand density
1.1 The Language of Science
Science is the study of natural phenomena. The language used in science can be confusing sometimes. Many often use terms like fact, hypothesis, law, and theory to explain natural phenomena incorrectly. The distinction between these terms is subtle. Theories, laws, and facts can start as hypotheses when they are first proposed and before they are rigorously tested. Generally, a fact is a very elementary statement based on some measurement, such as water boiling at 100 °C (212 °F). A Law is based on a collection of individual facts and is an attempt (usually with mathematics) to relate one set of measurable quantities to another (mass, speed, temperature, viscosity). Example, F=ma, V = d/t, PV = nkT. A theory attempts to explain why certain laws exist and why certain facts are true under specific conditions. Example 1: Planetary orbits are elliptical (fact) because gravity is an inverse-square force (law), and matter operates under Newton’s Laws of Motion. Example 2: Matter is comprised of atoms, and this explains how gases behave (laws), why we have specific chemical reactions (laws), and why the Periodic Table exists (facts). Are some facts more certain than others? Water always boils at 212° F at sea level, but at higher altitudes, it boils at lower temperatures. So, every fact depends on the specific circumstances under which it was measured.
- Fact – A basic statement based on some measurement, experiment, or observation. All facts are true under specific conditions.
- Hypothesis – A tentative statement such as ‘if A happens, then B must happen’ that can be tested by direct experiment or observation. A proven hypothesis can be expressed as a law or a theory.
- Law – A logical relationship between two or more things based on facts and proven hypotheses. It is often a mathematical statement of how two or more quantities relate.
- Theory – An explanation for why certain laws and facts exist that can be tested to determine their accuracy.
- Belief – A statement that is not scientifically provable in the same way as facts, laws, hypotheses, or theories.
Exercise 1.1 – The Vocabulary of Science
Sort the statements below as an example of a fact, hypothesis, law, theory, or belief.
| The diameter of the Earth is 12,756 km (7,926 mi). | Albert Einstein explained that massive objects (like the Earth) cause a distortion in space-time, which is experienced as gravity. |
| Aliens exist. | Energy and mass can neither be created nor destroyed. |
| Water freezes at 32°F (0°C). | For every action, there is an equal and opposite reaction. |
| The position of the planets can cause humans to act in specific ways. | The bell will ring at the end of the period. |
| The universe started with a massive expansion of space and time called the Big Bang. | Species evolve. |
| The oldest layers of rock are deeper, while the youngest layers are towards the top. | Some numbers are luckier than others. |
| Students who eat breakfast will perform better on a math exam than those who do not. | Species evolve through a process known as natural selection, in which certain organisms survive and reproduce more than others. |
| There are such things as ghosts. | Drinking sugary drinks daily leads to being overweight. |
| Humans are made of cells. | Force = mass x acceleration (F=ma) |
| Students who bring their own lunch spend less money throughout the day. | A meteorite impact caused the dinosaur extinction. |
1.2 The Scientific Method
The scientific method is a step-by-step procedure for how many scientists study the world. Often, scientists begin by observing some event or object and want to know why the event happened or why the object formed. Then, they develop a hypothesis to explain their observation and create an experiment to test the hypothesis. If the test results support the hypothesis, they develop a conclusion about the event or object. If the results don’t support the hypothesis, they go back, alter it accordingly, and retest it.

Exercise 1.2 – Everyday Use for the Scientific Method
You walk into an empty classroom and attempt to turn on the projector, but it doesn’t turn on (Figure 1.2). Use the scientific method to investigate and solve your problem. Write a statement about your issue for each step of the scientific method.

- What is your observation?
- What is your question?
- What is your hypothesis?
- What is your data?
- What is your analysis?
- What is your conclusion?
The Scientific Method and Geology
The scientific method in geology can look quite different. This is because many of the events that geologists investigate have already happened; so, they can’t make any direct observations. What geologists find is the evidence left behind by that event. An example is a solidified lava flow. Geologists know the lava likely came from a volcano, but they didn’t observe the eruption and can’t test the hypothesis by creating a new eruption. They have to rely on facts they know about current lava flows and volcanic eruptions to interpret past ones. In a sense, you might consider geology to be a historical science. Geology is the intersection of the other sciences (chemistry, physics, biology, and mathematics) applied to studying the Earth.
Uncertainty
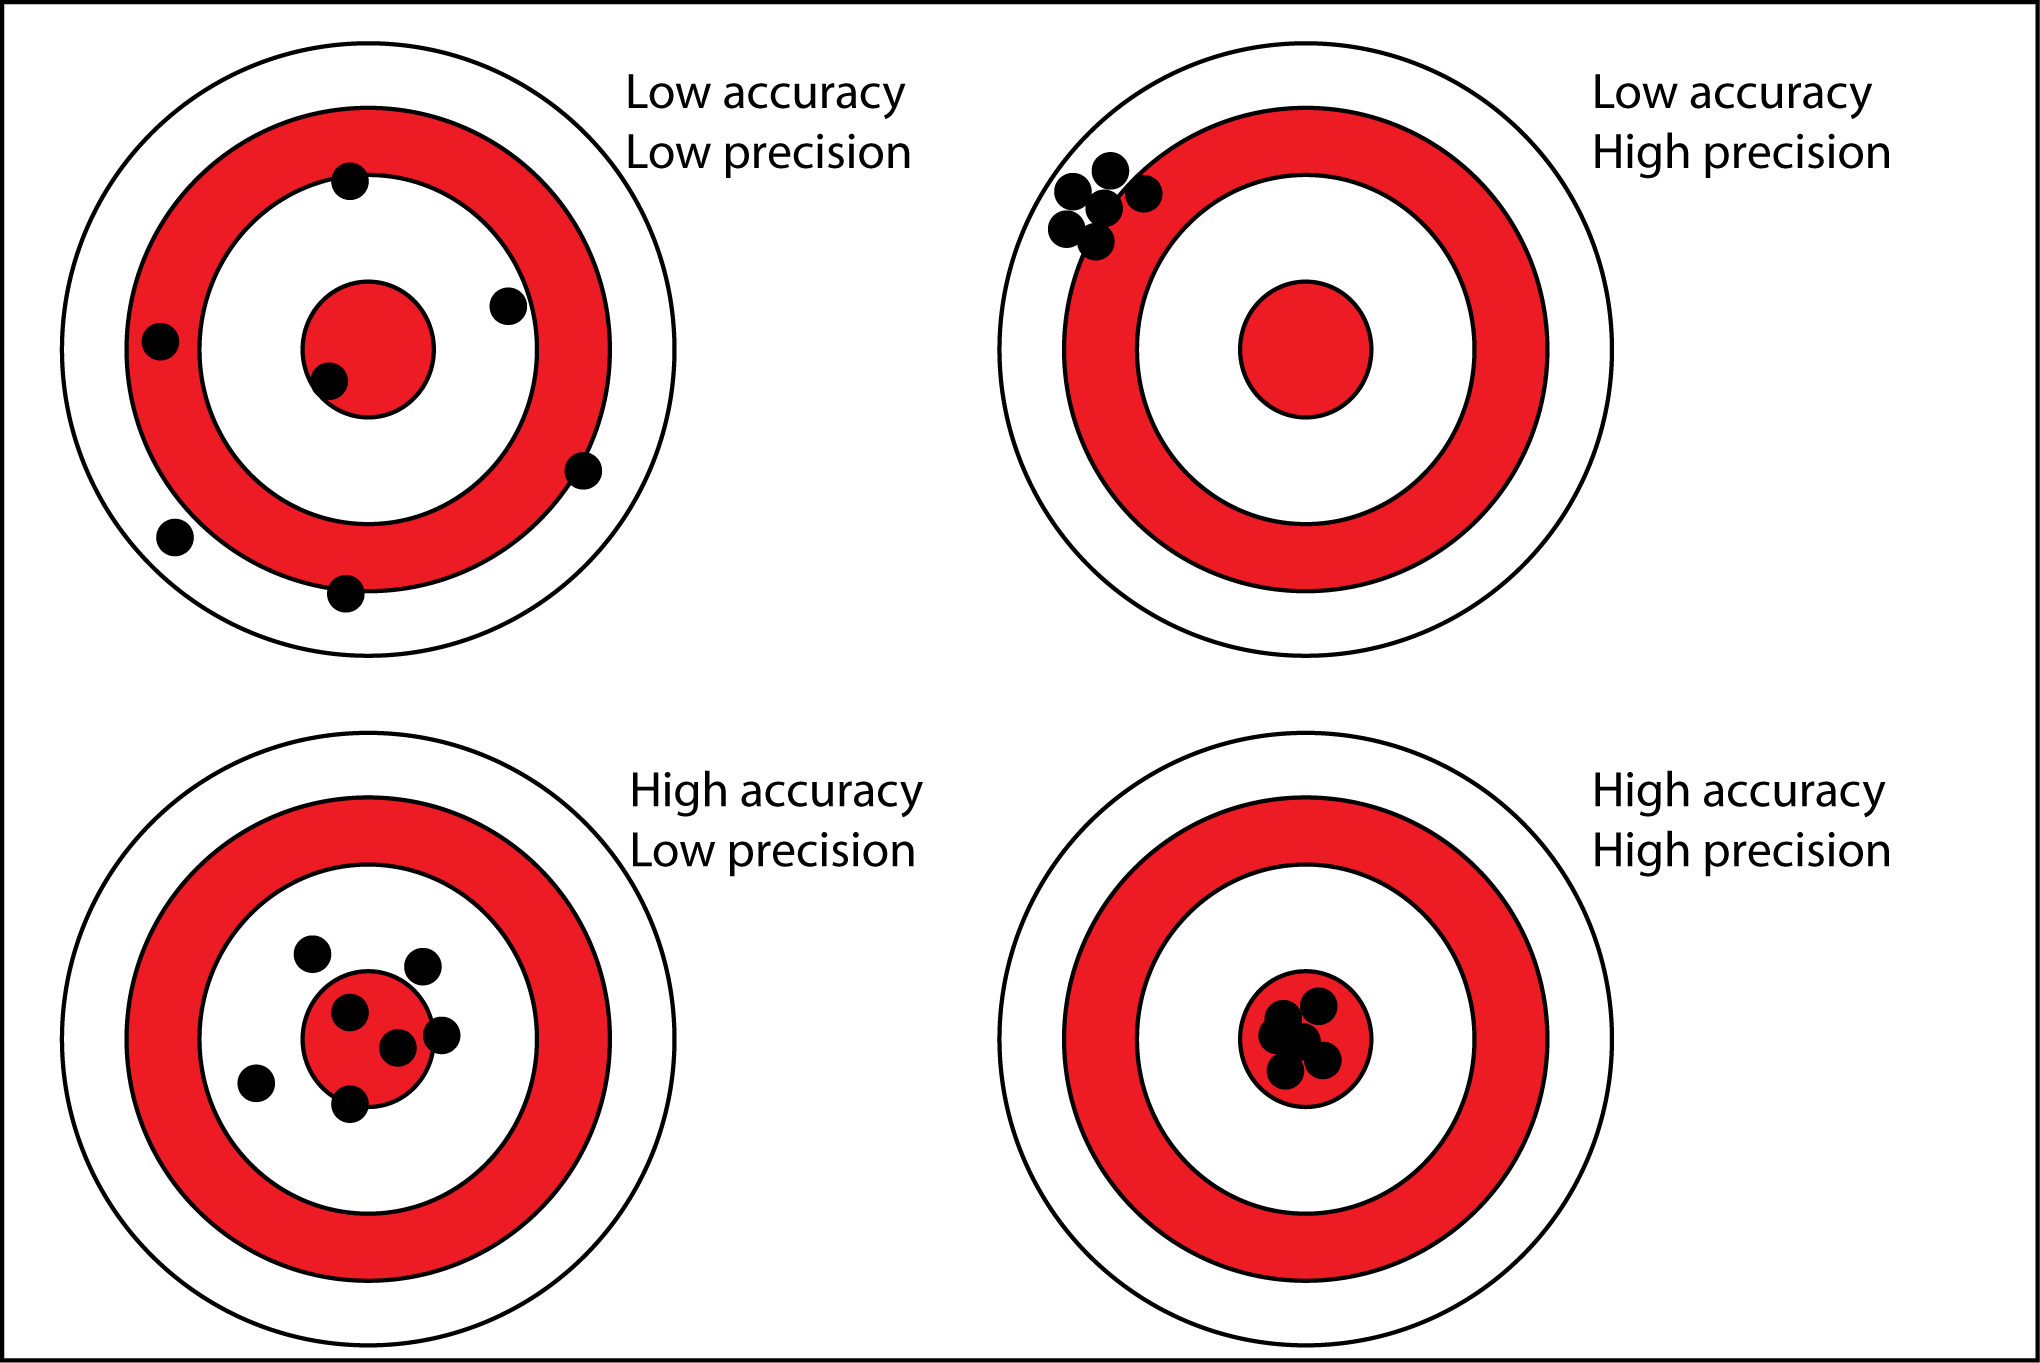
Because geologists often study past events they can’t directly observe, they must deal with uncertainty. Uncertainty in science doesn’t mean that scientists don’t believe their results or that their research is flawed. It represents natural variability in taking measurements. Often a scientific investigation does not yield an exact measurement. Instead, scientists make repeated experiments that give a range of measurements around a central value. This is where accuracy, precision, and statistics come in (Figure 1.3). For every measurement we make, there is an actual value that we are trying to obtain. In the next exercise, you will determine the weight of a rock. Simply put, accuracy is how close a measurement is to the actual true value, whereas precision is how close those measurements tend to be to each other.
For example, if geologists are trying to figure out when a volcano erupted lava, they would radiometrically date the solidified lava flow to determine when it formed (a topic discussed later). Remember, a single measurement may not be accurate; thus, repeated measurements are needed. If the measurements are around the same age, geologists are more certain about their results.
When doing any calculations for this or other exercises, you should consider the number of significant digits that you use. Your calculator will give you many significant digits, but these may not be appropriate for your result. The number of significant digits for your answers depends on the way you calculate. For addition and subtraction, round to the lowest significant number. For multiplication and division, your final answer should have the same number of significant digits as the least precise value given in the original problem. If you have forgotten how to do this, here is a refresher.
Exercise 1.3 – Working with Uncertainty
Your instructor has given your group a rock sample of unknown weight and an object of known weight.
- Each student should feel how heavy the object of known weight is. Then, each should heft the unknown rock sample in their hand and determine how much they think the rock weighs. Record these measurements in Table 1.1.
Table 1.1 – Rock measurements by hand Student Weight of unknown rock (g) 1 2 3 4 5 6 - What was the total range of measurements? ____________________
- What is the average of your measurements done by hand (use the appropriate significant digits)? ____________________
- Do you think your measurements are precise, accurate, both, or neither? Explain.
- Now, measure the weight of the rock sample on several scales provided by your instructor and report the results in Table 1.2.
Table 1.2 – Rock measurements by scale Scale Weight of unknown rock (g) 1 2 3 4 5 6 - What was the total range of measurements? ____________________
- What is the average of your measurements done using a scale (use the appropriate significant digits)? ____________________
- Do you think your measurements are precise, accurate, both, or neither? Explain.
- How close were your measurements done by hand to your scale measurements?
- Critical Thinking: What do you think is responsible for the differences in your measurements on the scales?
Extrapolation
Geologists often have limited data to work with to form hypotheses and analyses; after collecting data, they extrapolate their results. Extrapolation is a type of estimation based on current data. Imagine you are a geologist working in a tropical rainforest. Do you think you will find many rocks? Probably not, and if you do find any they are probably in rivers. Here’s the cool part, whatever you figure out about these rocks, you can guess that the whole rainforest has the same rocks. That’s extrapolation!
Exercise 1.4 – Extrapolation
Most of the world’s population has dark hair. In the United States, 85 percent of the population has black hair, while 11 percent has brown hair. Authentic blonde hair, which is quite rare, accounts for only 2 percent of the American population. Genuine red hair, the rarest of all hair colors, accounts for just 1 percent of the American population. How did scientists come up with this? To test this, let’s look at hair color on various scales.
- Identify the hair color of the students in your group. Determine the number of students with each hair color and what percentage they make up. To calculate percent: (number of students with black hair / total number of students) x 100.
Table 1.3 – Hair color of students in your group Hair Color Number of students Percentage of students Black Blonde Brown Red White/Gray Other: - Develop a statement about the most common and least common hair color in your group.
- With your limited data, is it reasonable to extrapolate the percentages of hair colors in your group for the entire class? Explain.
- Now complete the same chart again about your entire class.
Table 1.4 – Hair color of students in your class Hair Color Number of students Percentage of students Black Blonde Brown Red White/Gray Other: - Did your original statement apply to the entire class? Explain.
- Think about one of your lecture classes. Are the percentages of the different hair colors the same as for this lab?
- Can your group and class data be extrapolated to the entire US?
1.3 The Scale of Geology
Geologists work at various scales, from continents and mountain ranges to the atoms that make up rocks and minerals. Some scales like geologic time, are so big they’re difficult to truly comprehend. The Earth is 4,540,000,000 years old. To put this into perspective, if you have a penny for every year the Earth has been around, you will have $45.4 million! More on geologic time in another chapter.
Exercise 1.5 – Distance and Scale
Geologists do a lot of measuring, whether it’s distance, age, rates, etc. They also need to convert units, especially in the United States, where the metric system is not the norm.
- The accepted age of the Earth is 4.54 billion years old. If the average human lifetime is 72 years, how many human lifetimes has the Earth been around for? ____________________
- The generally accepted distance to reach outer space from the surface of the Earth is 100 km, called the Kármán Line. What is that distance in miles? (1 km = 0.62 mi) ____________________
- The distance to the center of the Earth is 6,371 km. What is that distance in miles? ____________________
- If you could drive to the center of the Earth at a highway speed of 65 mph, how many hours would it take for you to get there? ____________________
- Open Google Earth and measure the distance from New York City, NY, to San Francisco, CA, in kilometers and miles. What are the distances? ____________________
- Find a similar distance on another continent between two cities. Which two cities are they? ____________________
1.4 Maps, Maps, Maps
Maps are to a geologist as a wrench is to a mechanic, a common tool used to perform job duties. Geologists have their own type of map, aptly called a geologic map… very original. We’ll look at geologic maps later, but right now, you need a refresher on how to read basic map information.
Latitude and Longitude
Latitude and longitude constitute a geographic coordinate system used to locate positions on the Earth’s surface. Lines of latitude run from east to west, and lines of longitude run from north to south (Figure 1.4). The reference point for latitude is the equator (0°), which separates the northern and southern hemispheres. Degrees latitude go from 0° to 90°; positive values indicate a location north of the equator and negative values indicate a location south of the equator. The reference point for longitude is the Prime Meridian (0°), which separates the eastern and western hemispheres. Some maps show longitude from 0° to 359°, while others go from 0° to 180° for east of the prime meridian and 0° to -180° for locations west of the prime meridian.
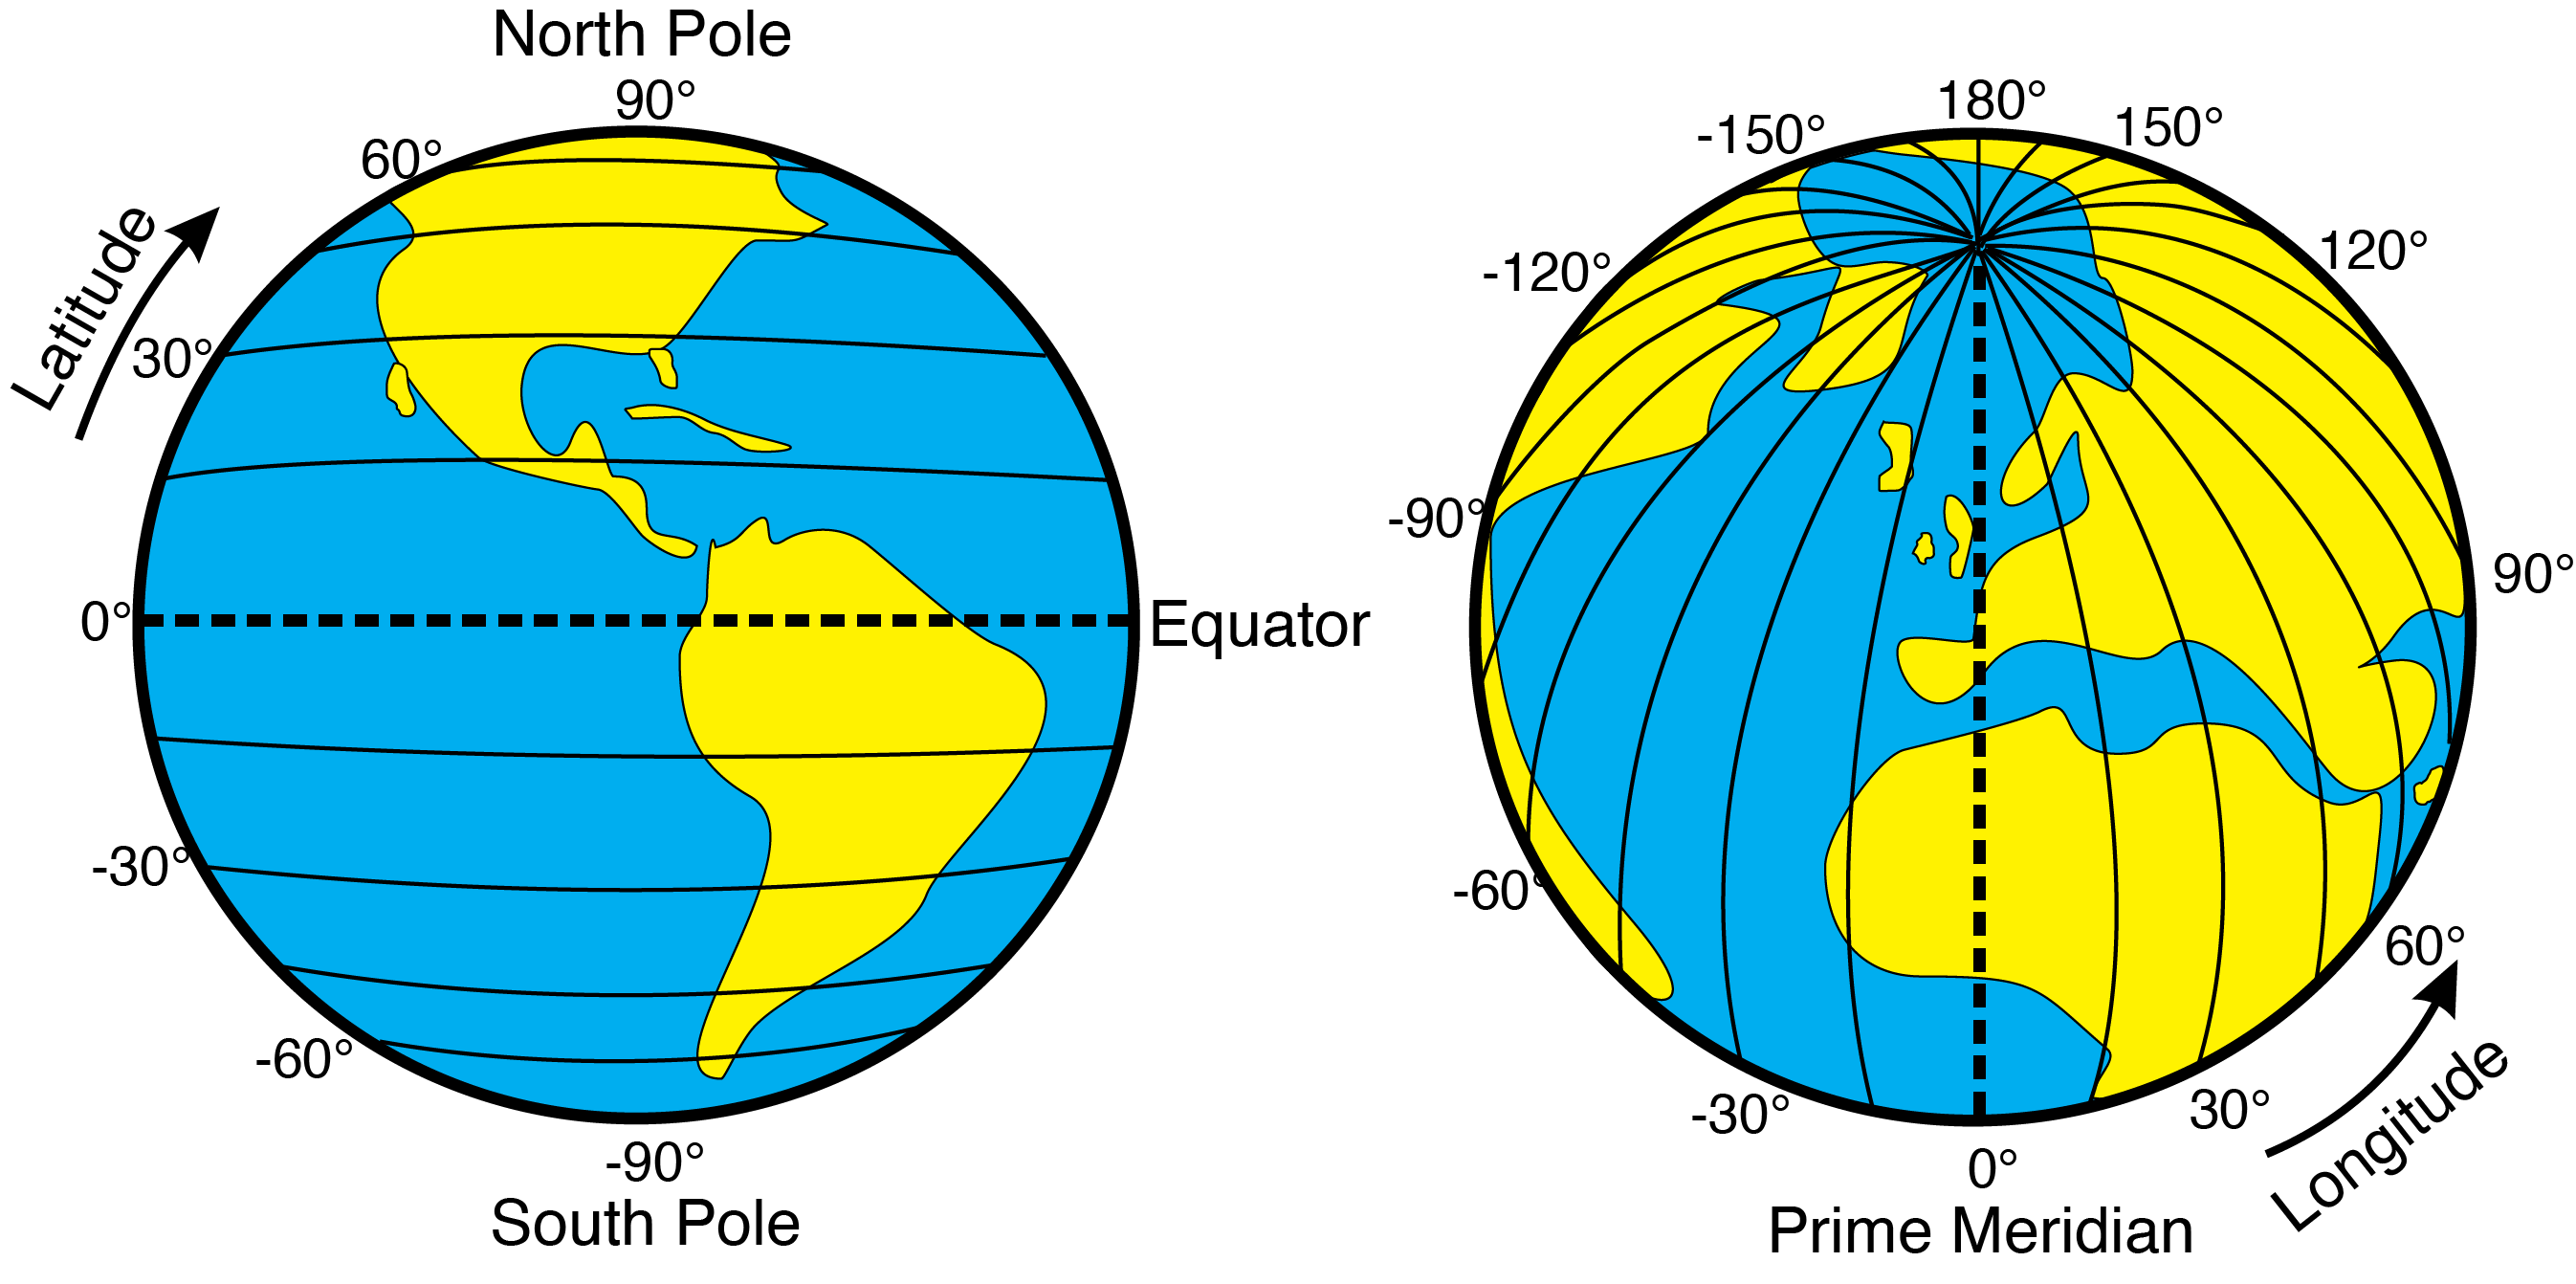
Combining latitude and longitude provides a unique coordinate to every bit of space on Earth’s surface. For example, Mt. Fuji in Japan is located at about 35°N 138°E. A more precise location for Mt. Fuji is 35°21′38″N 138°43′39″E. This coordinate system is in degrees (°), minutes (‘), and seconds (“), also known as DMS. Degrees range from 0 to 90, while minutes and seconds range from 0 to 60. Another way to display these spherical coordinates is using decimal degrees (DD). Those same coordinates for Mt. Fuji using decimal degrees are 35.36056°N 138.72750°E. While DMS is the classic way of representing coordinates, decimal degrees are easier when creating maps and plotting data with software.
One degree of latitude is approximately 111 km (364,000 ft or 69 mi), one minute equals 1.85 km (6,068 ft or 1.15 mi), and one second equals 30.8 m (101 ft). This is constant for all distances between points of latitude. Because longitude lines meet at the poles, lines are equidistant at the equator and get closer as you move toward one of the poles. At the equator, lines of longitude are 111 km (364,000 ft or 69 miles) apart. By 60° latitude, the distance between longitude lines is down to 56 km (35 mi). By 90°, the distance reaches zero. This explains why 2-dimensional maps of Earth distort landmasses to the south or north.
Exercise 1.6 – Latitude and Longitude
Let’s get some practice finding coordinates and measuring distances. Use Google Earth or a globe provided by your instructor to answer the following questions.
- Which ten countries does the equator pass through?
- Which eight countries does the prime meridian pass through?
- What are the geographic coordinates for your college/university? ____________________
- Using the latitude (to the nearest degree), how far north or south of the equator is your college/university in miles and kilometers? ____________________
- What are the coordinates for New York City, New York, and London, England?____________________
- In kilometers and miles, how much further north of the equator is London compared to New York City? ____________________
- What are the coordinates for the southernmost point in the continental United States? ____________________
- Which is at higher latitude, the border between the state of Washington and Canada or the border between Maine and Canada? What is the approximate latitude of each?
- Outside of Antarctica, which continent has the closest location to the south pole, and what are the coordinates (mainland only, no islands)? ____________________
This exercise is adapted from Mark W. Bowen, Minnesota State University, Mankato.
Topography
Throughout this book, we’ll look at various types of maps, including topographic maps. A topographic map shows changes in land surface elevation using topographic lines. This is how you can tell when a landscape feature is flat, mountainous, steep, shallow, etc., when looking at a map. A proper introduction to topographic maps will come later, but Exercise 1.6 is going to let you explore some of the rules.
Exercise 1.7 – Thinking About Topographic Maps
The Geoscience Learning Center at the University of Houston is equipped with several unique pieces of equipment for hands-on experience with geologic landscapes and processes. One of these tools is an interactive augmented reality sandbox capable of visually projecting topographic data in real-time onto the sandbox surface. Here, students can shape a “landscape” with their hands and watch as the projector provides a color gradient and topographic contour lines to represent variability in elevation across the sandbox (Figure 1.5).

Make two features in the sandbox. On one side, make a tall hill with a steep side and a shallow side. On the other side, make a basin (a depression like a lake). Answer the following questions.
- What color is at the top of your hill? ____________________
- What color is at the bottom of your basin? ____________________
- What do the colors mean?
- What do you think the lines represent?
- Why are these lines closer together in some places and further apart in others?
- Do the lines ever cross? Why or why not?
- Hold out an open hand over the sandbox to create rain. How does the water flow?
1.5 Earth Properties: Density
Earth materials have a range of many properties. One important property is density. You will learn in lecture how the Earth has 3 major layers, each with a different density. Density is the mass of a substance per unit of volume. For example, water has a density of 1.0 g/cm3, which means that a cubic centimeter of water weighs 1 gram. Density is determined by the size, mass, and arrangement of atoms in a substance, but the density of a material also varies with temperature and pressure. This variation is typically small for solids and liquids but much greater for gases. Applying pressure on an object reduces its volume, consequently increasing its density. Raising the temperature of an object (with a few exceptions) increases its volume, consequently decreasing its density. Some Earth materials may also have fluid or gas in pore space which reduce their density. Some geoscientists measure the density of rocks either wet or dry.
Aside from three major layers in the Earth, there are other important physical processes that are a result of density differences. Some of them are related to heat such as the density of air and water controlling currents, clouds and circulation in oceans, lakes and our atmosphere. These then affect processes such as erosion, transport of sand, and the shape of Earth’s landforms. So, density of Earth’s materials is fundamental to many processes you will learn about this semester.
Exercise 1.8 – Density
Your instructor will place a bowling ball and a golf ball in a container of water.
- Do you think both balls are going to float or sink? Explain.
- What did you actually observe? Did it match what you thought would happen?
- Create a hypothesis to explain your observation.
The size of objects can be very deceiving when it comes to density. In many cases, our minds think that bigger objects will always sink in water, but that isn’t always true. Take large cruise ships, for example.
It is easy to calculate the density of most objects, and we can do that with these materials.
density = mass/volume,  .
.
You can calculate the density of a sphere with the following equation:  where C is the circumference of the sphere that can be measured using string or tape.
- Measure the mass of the golf ball and bowling ball in grams (g). You may need to convert from kilograms (kg) to g.
- Mass of the golf ball: _______________
- Mass of the bowling ball: _______________
- Before we can calculate the volume of a sphere, we need to know its circumference. Measure the circumference of the balls in cm.
- Circumference of the golf ball: _______________
- Circumference of the bowling ball: _______________
- Calculate the volume of the ball in cm3 using the following equation: where C is the circumference.
- Volume of the golf ball: _______________
- Volume of the bowling ball: _______________
- Now that you know the mass and volume of the balls, calculate the density of each in
 .
.
- Density of the golf ball: _______________
- Density of the bowling ball: _______________
Exercise 1.9 – Density of Earth Materials
Believe it or not, rocks on Earth have varying densities based on their chemical composition and structure. Your instructor has provided you with two examples of similar-sized rocks.
- What differences do you notice between the two rocks?
- Does one rock feel heavier than the other? ____________________
- Let’s figure out the density of these rocks. Remember that density = mass/volume. (d=m/v). You can get the mass by weighing your rocks on a scale (Figure 1.6). Record the mass in grams for each rock.
- Mass of rock 1 __________
- Mass of rock 2 __________
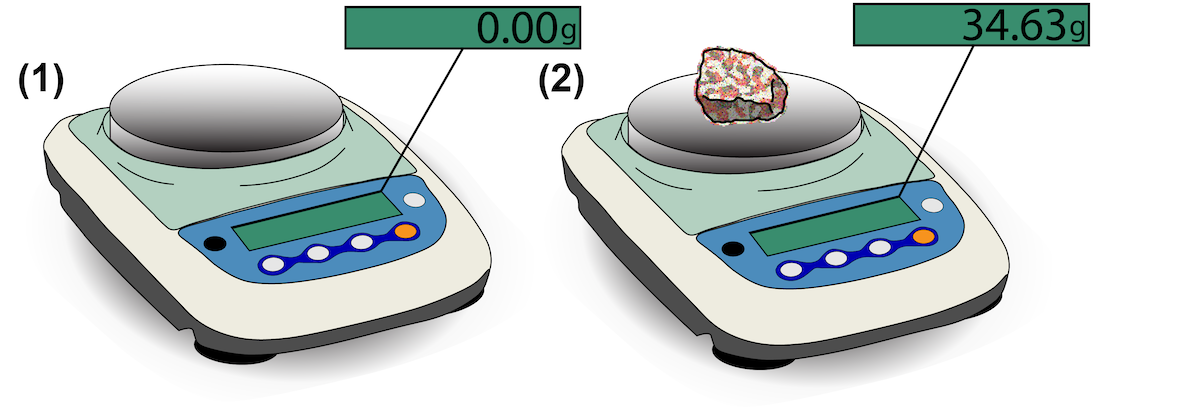
Figure 1.6 – Measuring the mass of a rock. Image credit: Michael Comas, CC BY-NC-SA.
- You can determine the volume of your rocks by measuring how much water is displaced in a container when you place the rock in it (Figure 1.7). Fill a graduated cylinder with water. It’s recommended you fill it to a milliliter value that is easy to work with, like 100 ml. Remember to measure from the bottom of the meniscus. Now, place one of your rocks in the graduated cylinder. You’ll notice the water level rise; that’s because the rock is displacing the water, and the amount of that displacement is equal to the volume of the rock. Measure this new volume of water. Subtract your starting volume from the new volume to determine the volume of your rock.
- Volume of rock 1 __________
- Volume of rock 2 __________
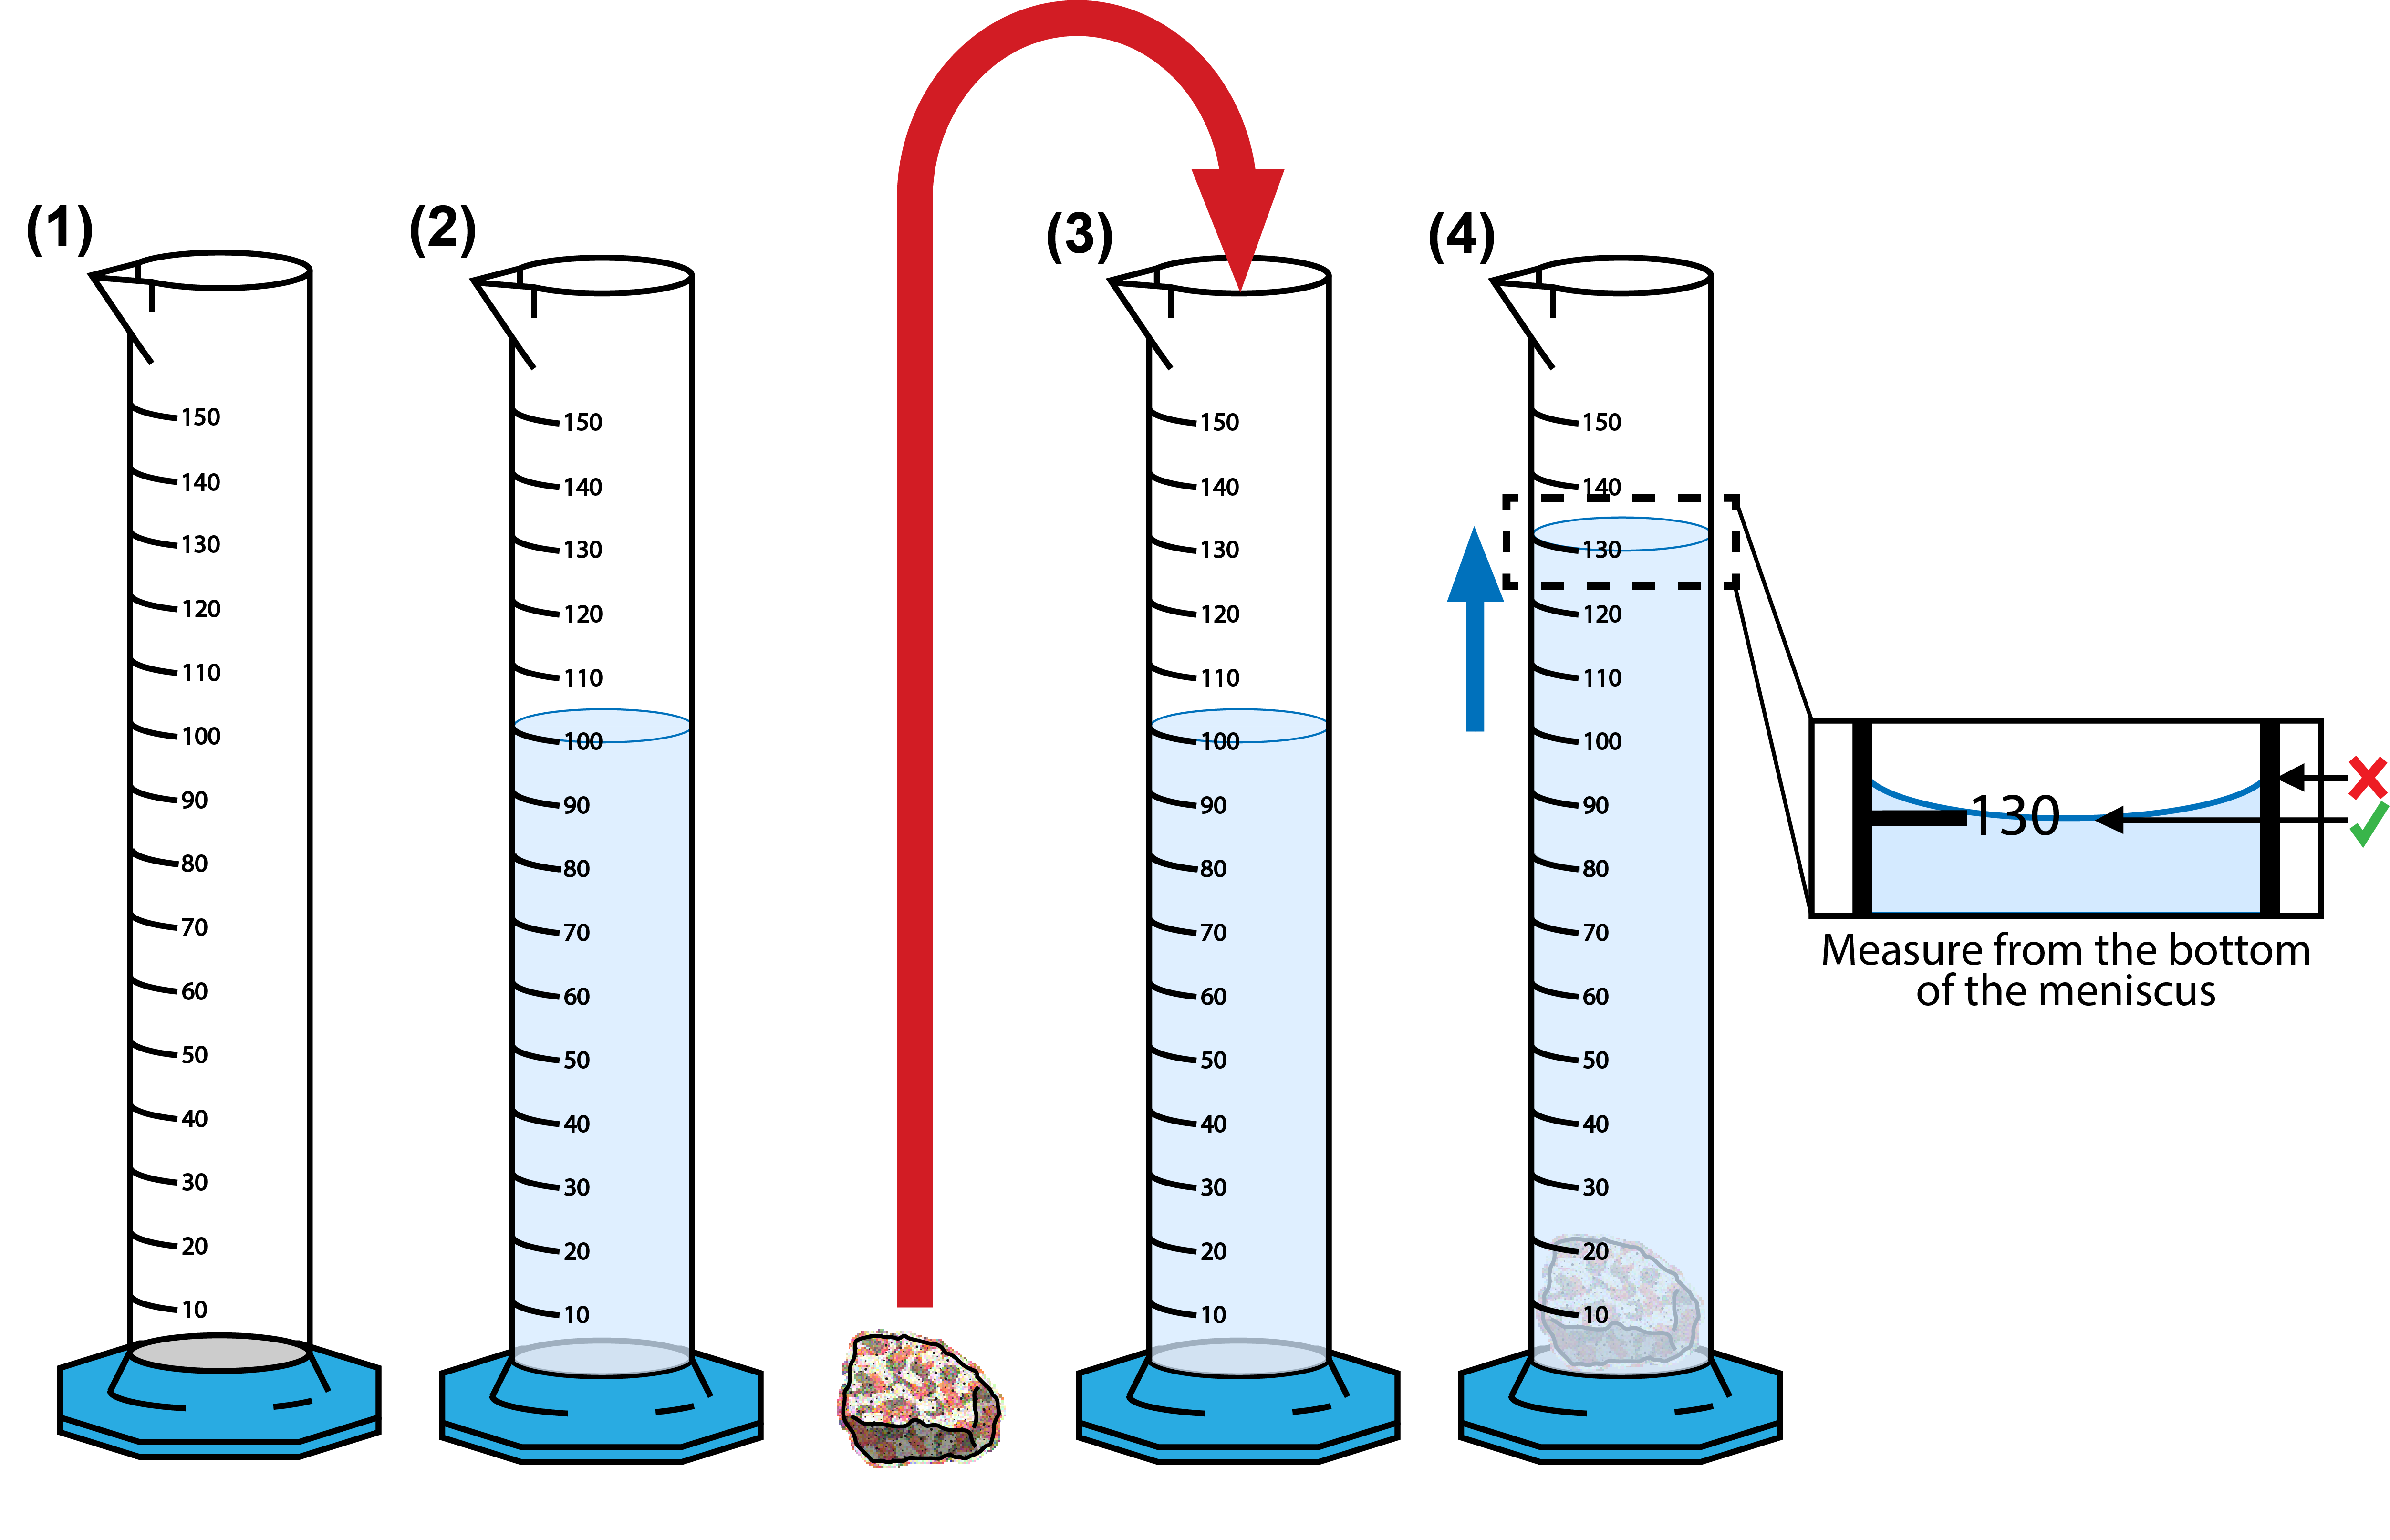
Figure 1.7 – Procedure for measuring the volume of a rock. Image credit: Michael Comas, CC BY-NC-SA.
- Now, determine the density of your rocks (d=m/v). The unit for density is g/cm3, 1 ml = 1 cm3.
- Density of rock 1 __________
- Density of rock 2 __________
- Why do you think there is a difference in density between the two rocks?
- Critical Thinking: Do you think these rocks formed in the same setting? Explain your reasoning.
Additional Information
Exercise Contributions
Daniel Hauptvogel, Virginia Sisson, Michael Comas, Somaria Sammy
an observation that's been confirmed many times so scientists can accept it as "true." But everything in science has some uncertainty; nothing is ever scientifically "true" beyond a shadow of a doubt.
an idea or proposition that can be tested by observations or experiments, about the Earth
laws of science are statements, based on repeated experiments or observations, that describe or predict a range of natural phenomena
explains known facts and also allows scientists to make predictions of what they should observe
observational error that indicates how close measurements are to their true value
observational error that indicates how close measurements are to each other.
the number of digits needed to accurately describe a measurement, starting from the first nonzero digit.
