
Chapter 6: Weathering and Sedimentary Rocks
Differential Weathering, Classification, and Depositional Environments
This book contains exercises for a physical geology lab class. It is under development, with a full 1st edition release planned for Fall 2024.
The goals of this chapter are:
- Analyze weathering rates
- Understand sedimentary rock classification
- Apply factors to interpret depositional environments
Weathering is what takes place when a rock is exposed to the “weather” or to the forces and conditions at Earth’s surface. A rock exposed at the surface can experience changes in temperature as well as oxygen and other gases. Additionally, in many regions, water is abundant.
Weathering includes two different processes. One is a chemical change in the minerals within a rock and the other is mechanical breakdown of rock into smaller fragments. These go hand in hand as mechanical weathering produces fresh surfaces for attack by chemical processes, and chemical weathering weakens the rock so that it is susceptible to mechanical weathering. Together, these processes create two products, one being the sedimentary clasts and ions in solution that can eventually become sedimentary rock, and the other is soil necessary for our existence on Earth.
Exercise 6.1 – Weathering Rates
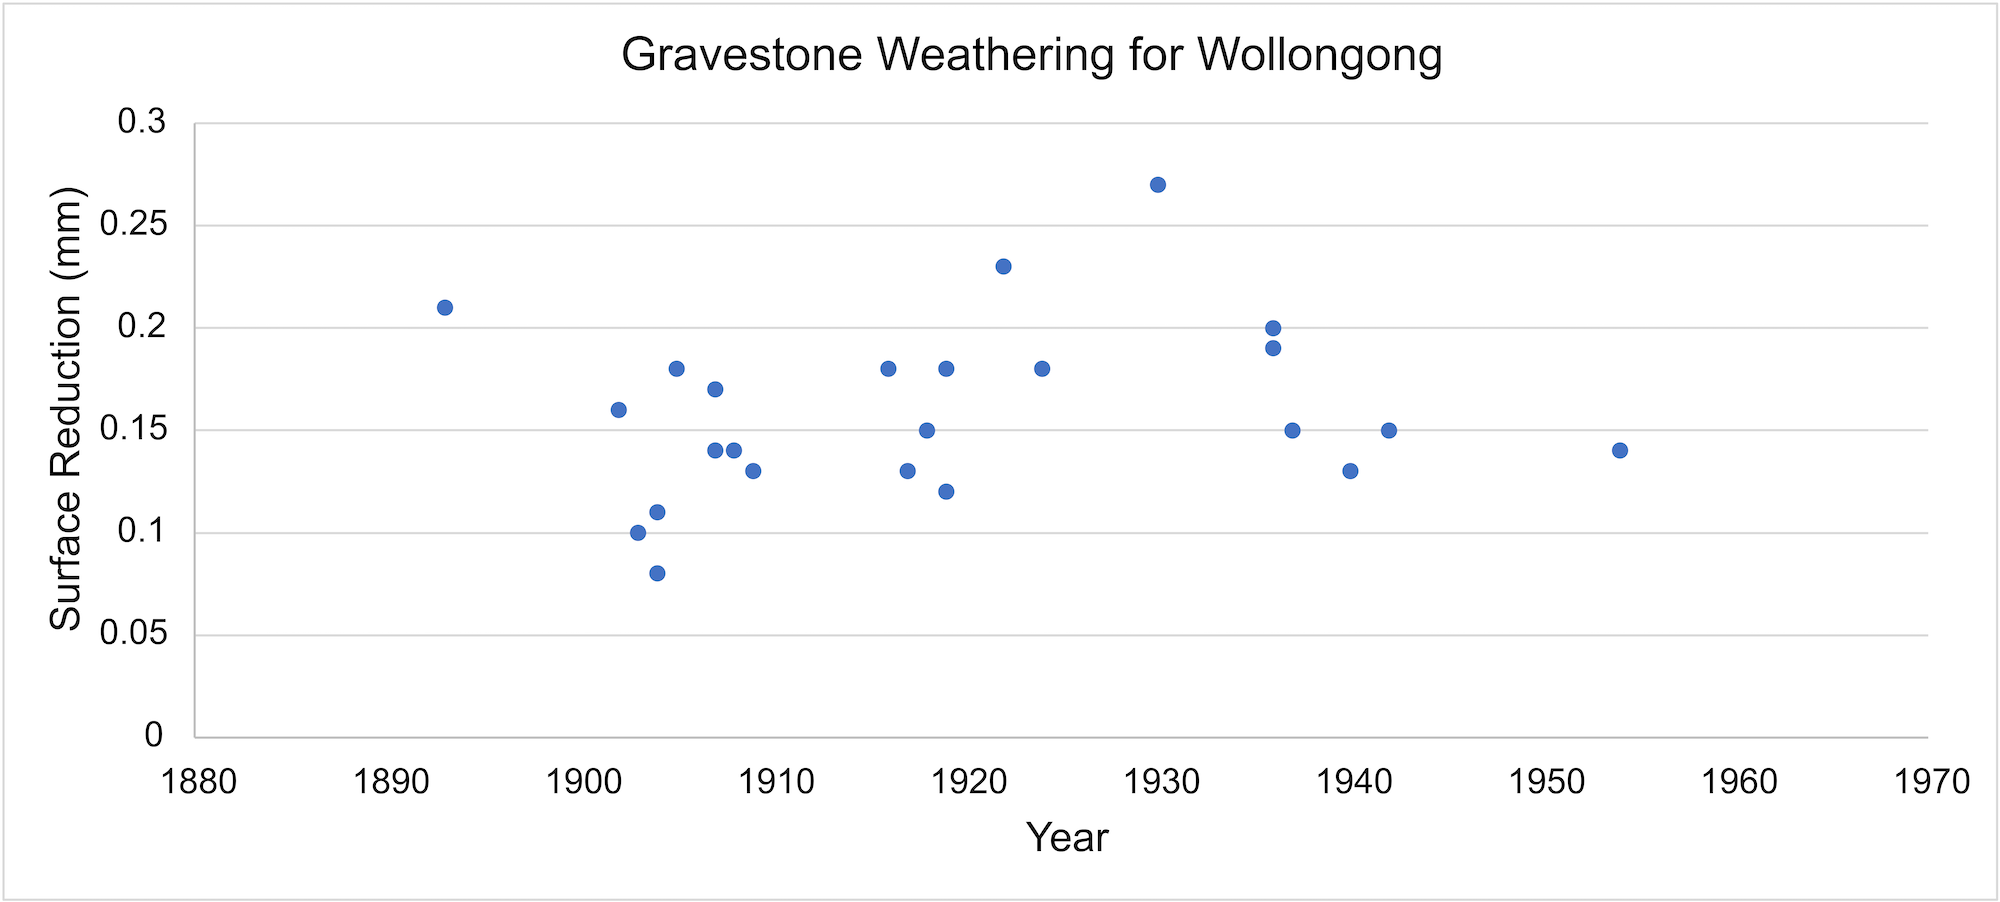
The weathering rate of rocks and minerals is affected by the composition of the atmosphere, temperature and rainfall rates, even at a local level. Below are the results of a study of marble gravestones in Australia (Figures 6.1 and 6.2). The data is from two areas: an urban residential area in Sydney and an industrial area in Wollongong (65 km or 45 miles south of Sydney). The year is when the gravestones were inscribed. The surface reduction measures how much weathering has occurred on the gravestones’ surface.
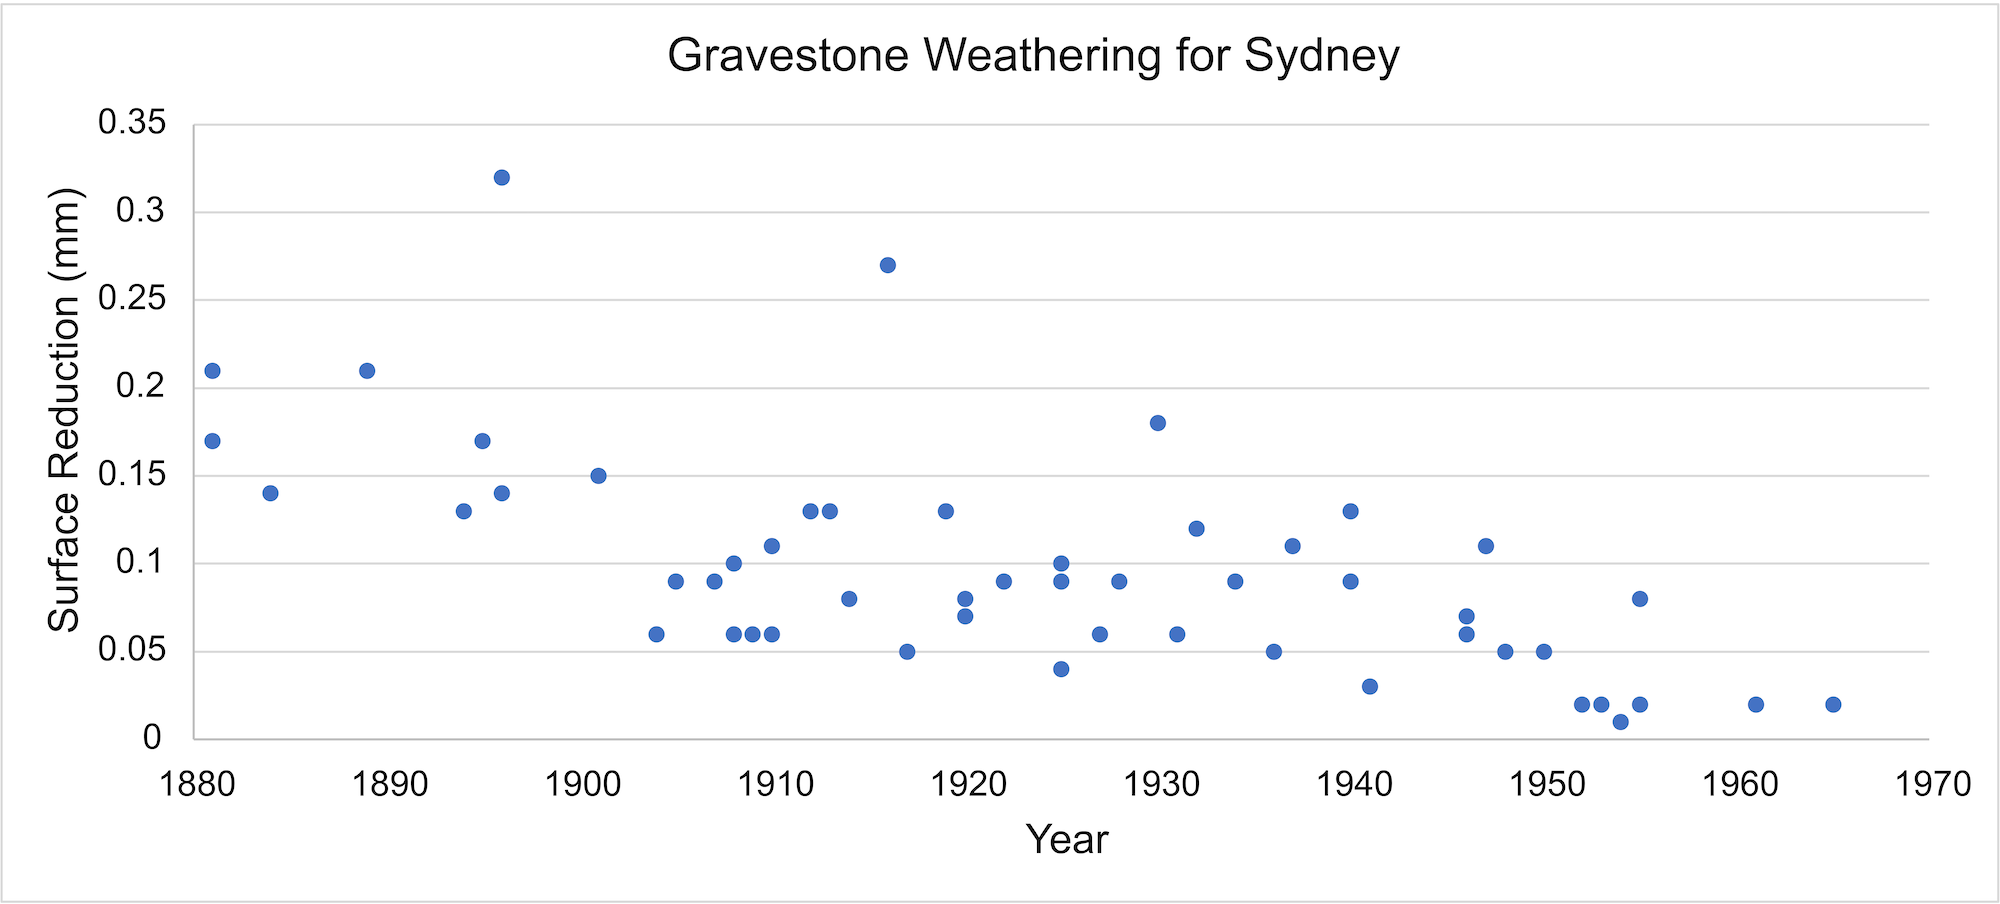
- Describe the relationship between surface reduction (or weathering depth) and age in Sydney?
- What is the relationship between surface reduction (weathering depth) and age in Wollongong?
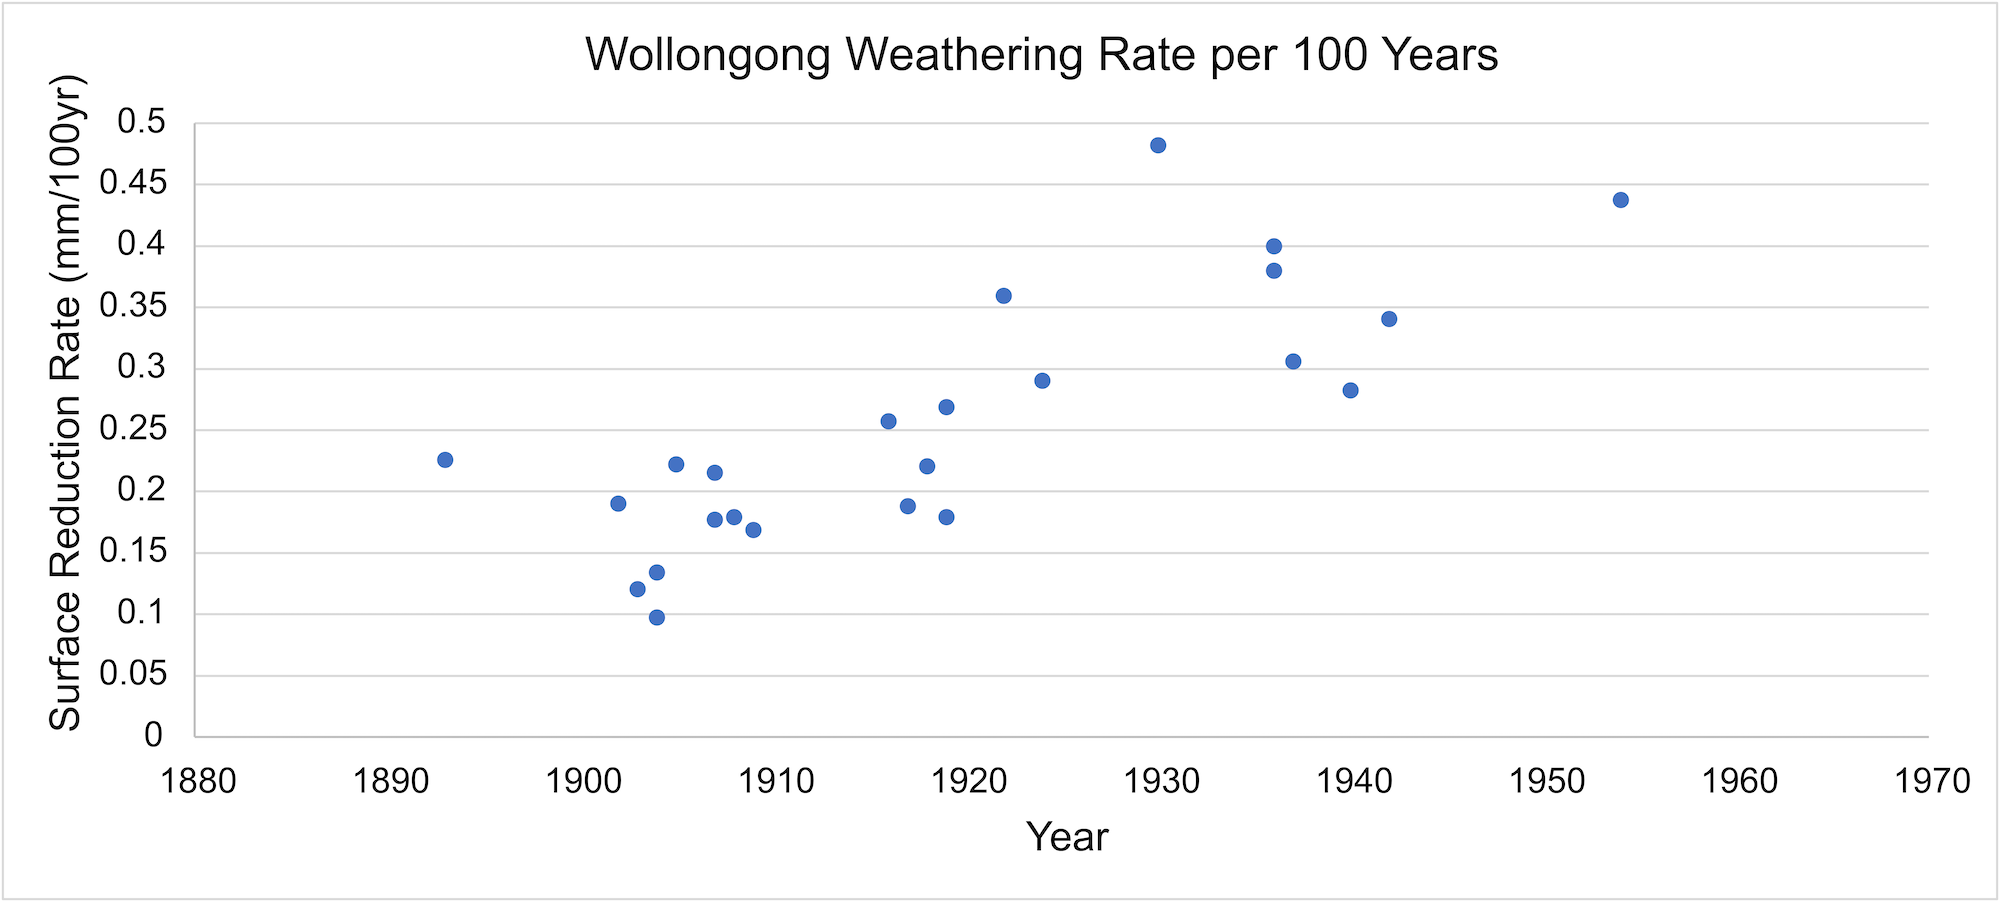
The slope of the line that best fits this data will determine an average surface reduction (weathering rate). For example, using a trend line for the Sydney data (Figure 6.1), the weathering rate is ~0.17 mm/year. Look closely at the data and you will see that a some of the data points fall far from a trend line. Thus, this data is better analyzed by reinterpreting it as a rate of surface reduction (weathering rate) per 100 years (Figures 6.3 and 6.4).

- What is the average weathering (surface reduction) rate per 100 years for Sydney? ____________________
- Has the rate of weathering changed for Sydney? If so, can you locate when the change occurred?
- What is the average weathering (surface reduction) rate per 100 years?
- Has the rate of weathering changed for Wollongong? If so, can you locate when the change occurred?
- Critical thinking: Compare the weathering rate over time for both sites. Which are the principal factors controlling weathering rate between the two sites? Do you think this similarity or difference will continue in the future?
This exercise is adapted from G.S. Hancock and C.M. Bailey.
What happens after weathering? Well, this depends on if there was chemical weathering as you investigated in Exercise 6.1 or mechanical weathering. First, there can be transport of the water saturated with chemical ions or of the broken pieces of rock (clasts). Next is deposition of these. Finally there is lithification which turns these from loose grains to solid rock. The next two exercises will focus on the practical of how to identify and classify sedimentary rocks.
Exercise 6.2 – Observing Sedimentary Rocks
Your instructor has provided you with a set of rocks. Continuing with our ideas of classification, sort these rocks into groups based on any criteria you want to use. Your instructor may ask you to re-classify the materials several times using different criteria.
- Which criteria did you use? Why?
b. Did you need to reclassify your samples? If so, which criteria changed?
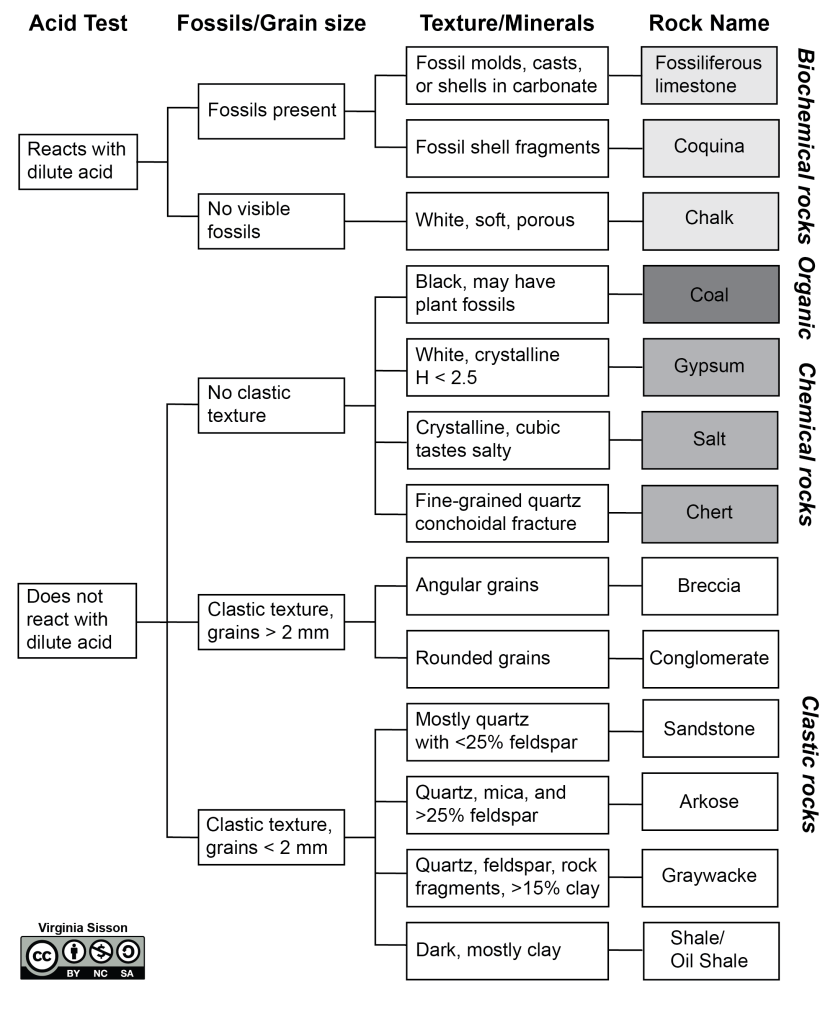
Sedimentary rocks (Figure 6.5) are classified as clastic, chemical, and organic based on how they form. The most common way sedimentary rocks form is when other rocks weather into small particles and are transported by wind, water, or ice to an area where they are deposited. These are called clastic sedimentary rocks and are classified based on their grain size. Sedimentary rocks can also form through chemical or organic processes. If you have a body of water containing dissolved salt and then that water evaporates, it will leave behind the salt as a solid mineral form called a precipitate, which is a chemical sedimentary rock. Organic sedimentary rocks form from the accumulation of organic debris. This organic material would need to be buried very quickly, so it doesn’t decay. Organic material in sedimentary rocks is where coal, oil, and natural gas come from. Then, there are sedimentary rocks that we can classify as biochemical. For example, foraminifera are tiny, single-celled organisms that build shells out of calcium carbonate. After they die and decay, their shells may sink to the bottom of the ocean and accumulate to form a sedimentary rock. In this case, biological processes caused the chemical precipitation of the mineral for the shell, but it doesn’t contain organic compounds, so we call it biochemical.
In all cases, sediments need to undergo lithification to transform from loose grains to a solid rock. Typically, two steps are involved in turning sediment into asedimentary rock; compaction and cementation. When grains are deposited, they typically have empty spaces between them called pores (porosity). Compaction reduces porosity by bringing the grains closer together. The best analogy to think about is your garbage can at home. When the garbage can is full, do you change the bag right away or do you push down on it to create more room? By pushing down on trash, you reduce the space between the pieces of garbage and create more room at the top; this is compaction. Sediments work the same way, but what’s causing the compaction is the accumulation of more sediment on top of the previously deposited material. The more sediment piled on top, the more compact the sediment beneath it becomes.
Cementation is a process that happens during either at the surface or during compaction. As sediments interact with water, minerals precipitate in pore space acting as a glue that holds the sediment together. During compaction, water is squeezed out of the pore spaces; this enhances cementation. The common minerals that make up cement are calcite, quartz, and pyrite.
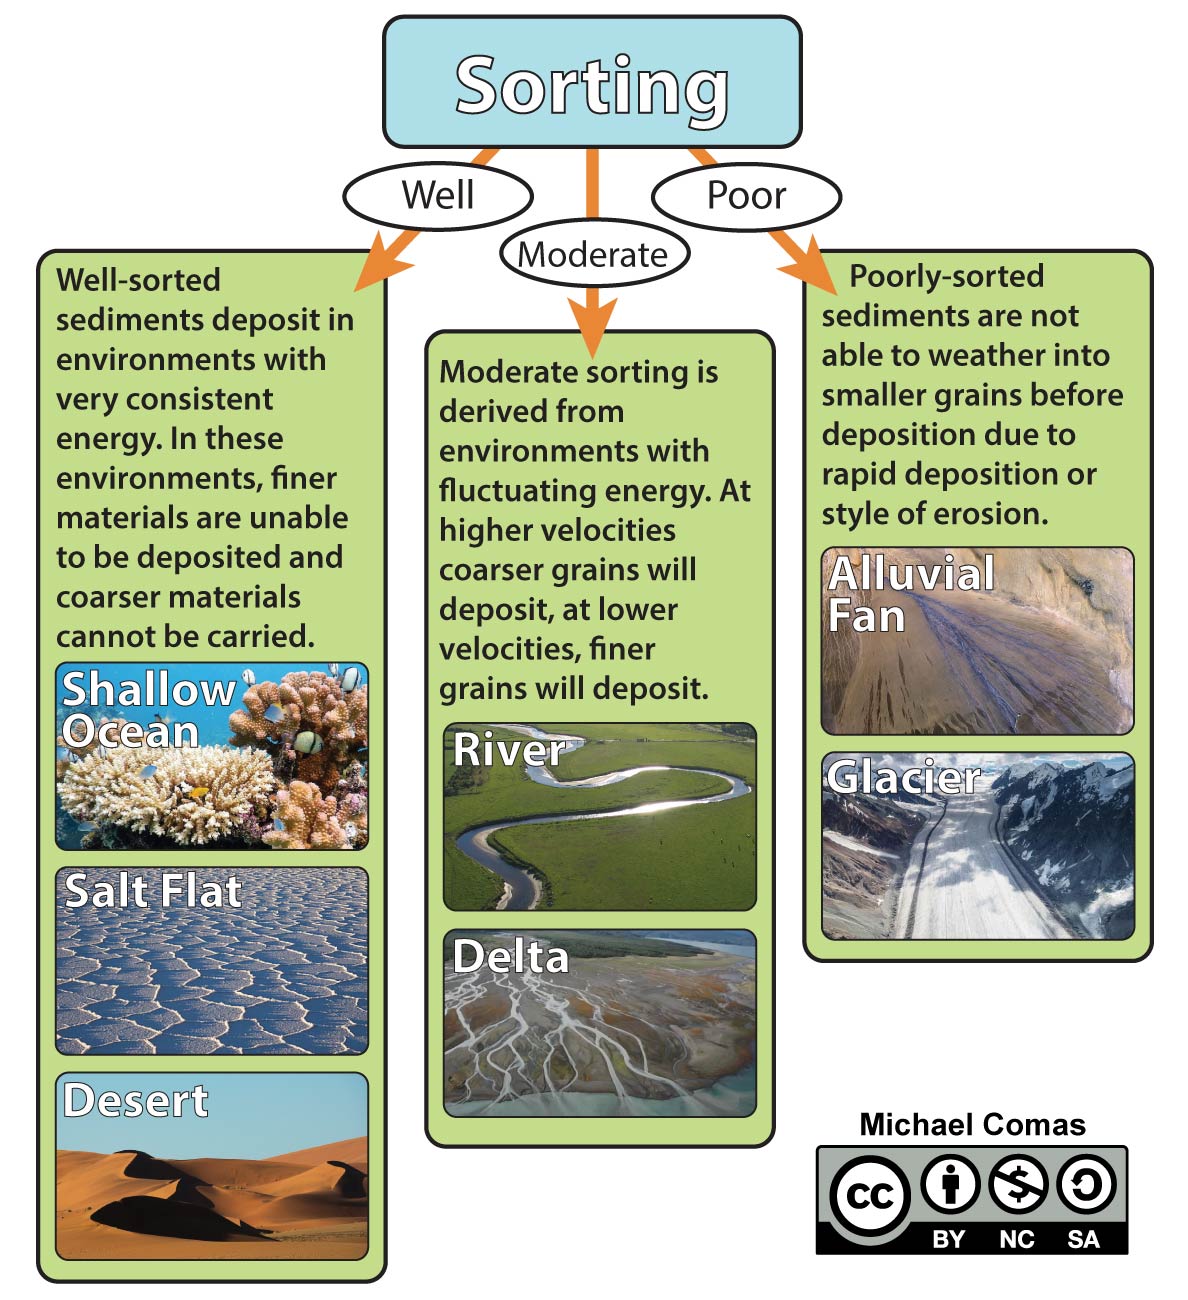
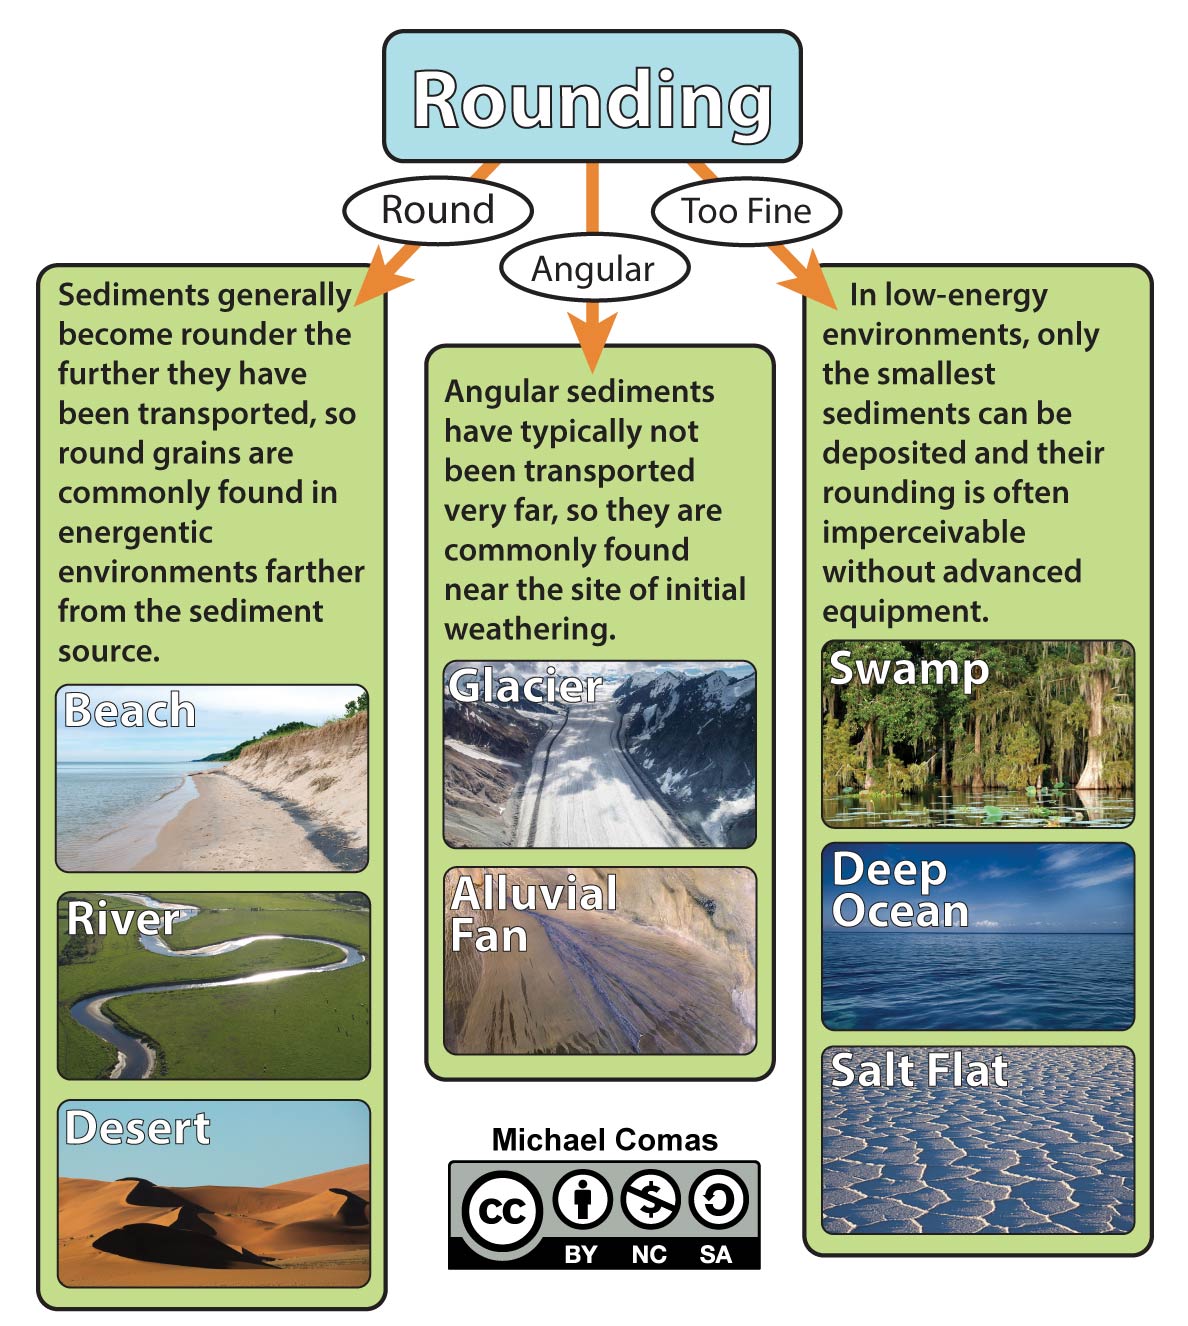
The size and shape of grains within sedimentary rocks can also help you interpret that sediment’s history (Figure 6.6). When all the grains in the rock are about the same size, it is called well-sorted. Usually, sediment needs to travel a far distance from its source to be well-sorted. In contrast, poorly sorted sediment is deposited very close to its source. The rounding of sediment grains is also an indicator of how far the sediment traveled. Grains that have smooth edges are considered well-rounded and have traveled a far distance. These grains start out with rough edges and become smoother as they travel further and further. In contrast, grains with sharp edges are considered angular and have not traveled a far distance (Figure 6.6).
In addition to rock composition, a primary tool for classifying sedimentary rocks is their grain size (Figure 6.5 to 6.7). This can be measured with a ruler, weighing the proportions that accumulate in a series of wire mesh screen sieves, visually with a petrographic microscope, or by determining the rate at which particles of varying diameter accumulate in a water-filled glass cylinder (known as a settling tube).


Exercise 6.3 – Identifying Sedimentary Rocks
Your instructor has given you a set of unknown sedimentary rocks. Identify the characteristics and names of these rocks using Figures 6.5 and 6.6 and fill out Table 6.1.
| Sample | Classification | Grain Characteristics (size, shape, sorting) | Minerals you can see | Rock Name | Depositional Environment |
|
|
|||||
|
|
|||||
|
|
|||||
|
|
|||||
|
|
|||||
|
|
|||||
|
|
|||||
|
|
|||||
|
|
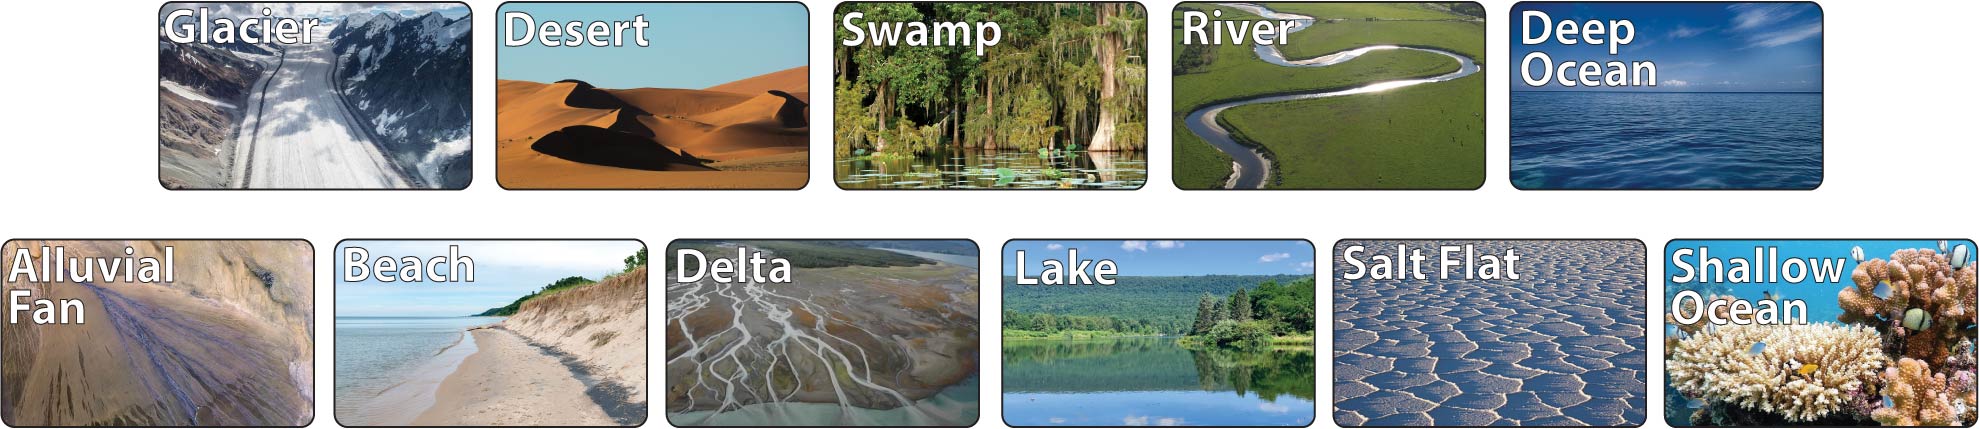
Sedimentary rocks contain clues that tell you about the environment was like at the time of their deposition. Figure 6.7 contains imagery for several common sedimentary environments. Interpreting depositional environments based on the sedimentary rock characteristics is a very important part of a sedimentary geologist’s job. Many environments share characteristics in their deposits with other environments; for example, deserts and beaches commonly leave behind deposits of quartz-rich, well-sorted sands. There may also be a wide variety of deposits within a single type of environment; for example, a slow-moving river may deposit silty mud in its channel, while a rapidly flowing river may deposit coarse sands and pebbles. Due to the variety in deposits and overlapping characteristics, it takes a well-trained eye to accurately determine the correct depositional environment for many sedimentary rocks.
Exercise 6.4 – Sedimentary Environments
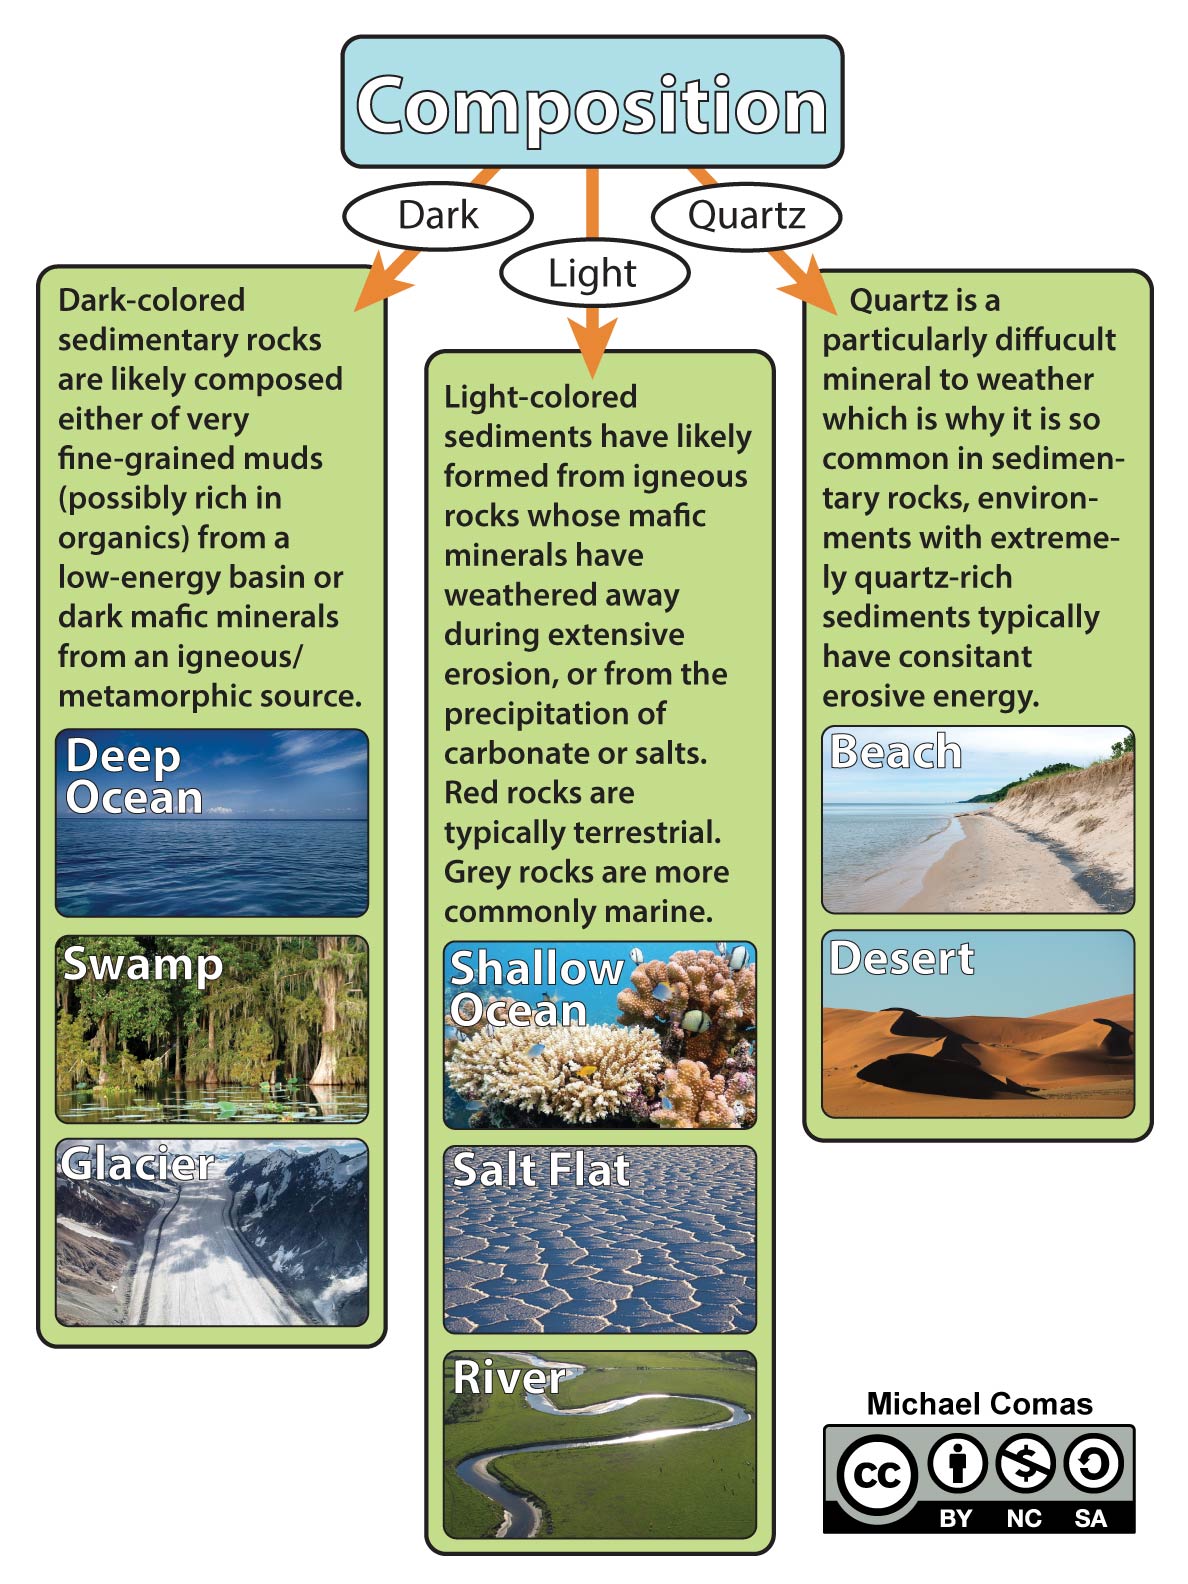
Below, you have been provided with branching diagrams that group depositional environments based on shared characteristics (Figures 6.8 – 6.12). Note that environments grouped in one diagram are often not grouped in others. The characteristics of sediments deposited in a system are broadly controlled by the proximity of the deposit to the sediment source and how much energy is moving through the system.

- Use Figures 6.8 – 6.12, along with your knowledge of sediments and their structures, to help discern a possible depositional environment for each of your sedimentary rocks provided by your instructor. Fill in this information in Table 6.1.
- Critical thinking: Which sedimentary features are useful for determining whether the depositional environment is continental versus marine? Are there any sedimentary features that will determine the sedimentary environment with just one feature?
Go back and look at Figure 4.2 which shows that the most common rock type covering North America are sedimentary rocks! Now that you can recognize different rock types and interpret where they were formed, you can start to explore geologic maps. Perhaps investigating one of these will encourage you to go explore. Or use the information from this map to determine where to find economic resources such as limestone for concrete, shale to make bricks, sandstone as a place for fossil fuels and drinking water and halite deposits for salt. Or use them to help you find fossils such as the Texas state fossil wood or a dinosaur. Some use sedimentary rocks for jewelry and ornamental stones. Bet you didn’t realize that there were so many reasons to want to find out about sedimentary rocks. The next exercise will explore some of the sedimentary rocks in Texas.
Exercise 6.5 – Sedimentary Rocks of Texas
Explore the geologic map of Texas. Each colored polygon represents a different rock unit. Clicking on the polygon will pull up information about that rock.
- Look near Austin, TX for the rock labeled “Ked.” Give is the name of this rock formation? ____________________
- List the types of sedimentary rocks are here?
- Are these clastic, chemical, biochemical, or organic rocks? ____________________
- Which rock samples from your kit would be similar to those in this rock group? ____________________
- What do you think was the depositional environment? ____________________
- Look at the extent of this rock group on the map. Describe its orientation. Why do you think it has this shape?
- Look near Marble Falls, TX for the rock labeled “Crh” (dark brown unit to the north). Give the name of this rock formation? ____________________
- List types of sedimentary rocks are here?
- Are these clastic, chemical, biochemical, or organic rocks? ____________________
- Which rock samples from your kit would be similar to those in this rock group? ____________________
- What do you think was the depositional environment? ____________________
- Look at the extent of this rock group on the map. Describe its orientation. Why do you think it has this shape?
Additional Information
Exercise Contributions
Daniel Hauptvogel, Michael Comas, Virginia Sisson
References
D. Dragovitch, 1986, Weathering rates of marble in urban environments, eastern Australia; Zeitschrift für Geomorphologie, v. 30, p. 203-214
Image credits for Figures 6.8-6.12
- Glacier – Jacob Frank, Public Domain
- Desert – Pixabay user kuloser, Public Domain
- Swamp – Wikimedia user Pierre5018, CC BY-SA
- River – Simon Ledingham, CC BY-SA
- Deep Ocean – Johann Piber, Public Domain
- Alluvial Fan – NASA, Public Domain
- Beach – Michigan Department of Natural Resources, Public Domain
- Delta – NOAA, Pubic Domain
- Lake – Wikimedia user Zeete, CC BY-SA
- Salt Flat – Wallpaper Flare, Public Domain
- Shallow Ocean – Wallpaper Flare, Public Domain
sedimentary rocks composed of fragments, or clasts, of pre-existing minerals and rock. These are typically the result of physical weathering.
sedimentary rock formed by chemical and organic reprecipitation of the dissolved products of chemical weathering.
sedimentary rock formed by the accumulation and lithification of organic debris, such as leaves, roots, and other plant or animal (shells or skeletal) material.
leaves, roots, and other plant or animal material
for organic matter, decay is rot or decomposition by the action of bacteria, insects and fungi
sometimes called forams; a single-celled planktonic animal with a chalky shell through which slender protrusions of protoplasm extend. Most are marine organisms, and when they die, their shells form thick ocean-floor sediments.
a type of chemical sedimentary rock that have a biologic component to their origin.
a complex process in which loose grains of sediment are converted into rock. Lithification may occur when a sediment is deposited or later.
exertion of force on something so that it becomes denser
binding together of rock particles by cement
having minute spaces or holes through which liquid or air may travel
a white or colorless mineral composed of calcium carbonate. Often found in sedimentary rocks such as limestone and is deposited in caves to form stalactites and stalagmites
a hard white or colorless mineral consisting of SiO2, silicon dioxide, found in all rock types, the stable polymorph at the Earth's surface. It is often colored by impurities as in amethyst and citrine.
a shiny yellow mineral consisting of iron disulfide and typically occurring as intersecting cubic crystals. Also called fool's gold.
distribution of grain sizes in sedimentary rocks
the degree of smoothing from interaction of sedimentary particles.
a type of optical microscope used to identify rocks and minerals in thin sections.
