
10.3 Integrating Excel® with Word® and PowerPoint®
Learning Objectives
- Learn how to paste an image of an Excel chart into a Word document.
- Learn how to paste a link to an Excel chart into a PowerPoint slide.
- Learn about the types of integrations across Office Suite applications.
Charts that are created in Excel are commonly used in Microsoft Word documents or for presentations that use Microsoft PowerPoint slides. Excel provides options for pasting an image of a chart into either a Word document or a PowerPoint slide. You can also establish a link to your Excel charts so that if you change the data in your Excel file, it is automatically reflected in your Word or PowerPoint files. We will demonstrate both methods in this section.
Pasting a Chart Image into Word
For this exercise you will need two files:
- The Excel spreadsheet you have been working with during the Charts & Graphs chapter: CH4 Charting.
- A Word document data file — CH4 Diversity
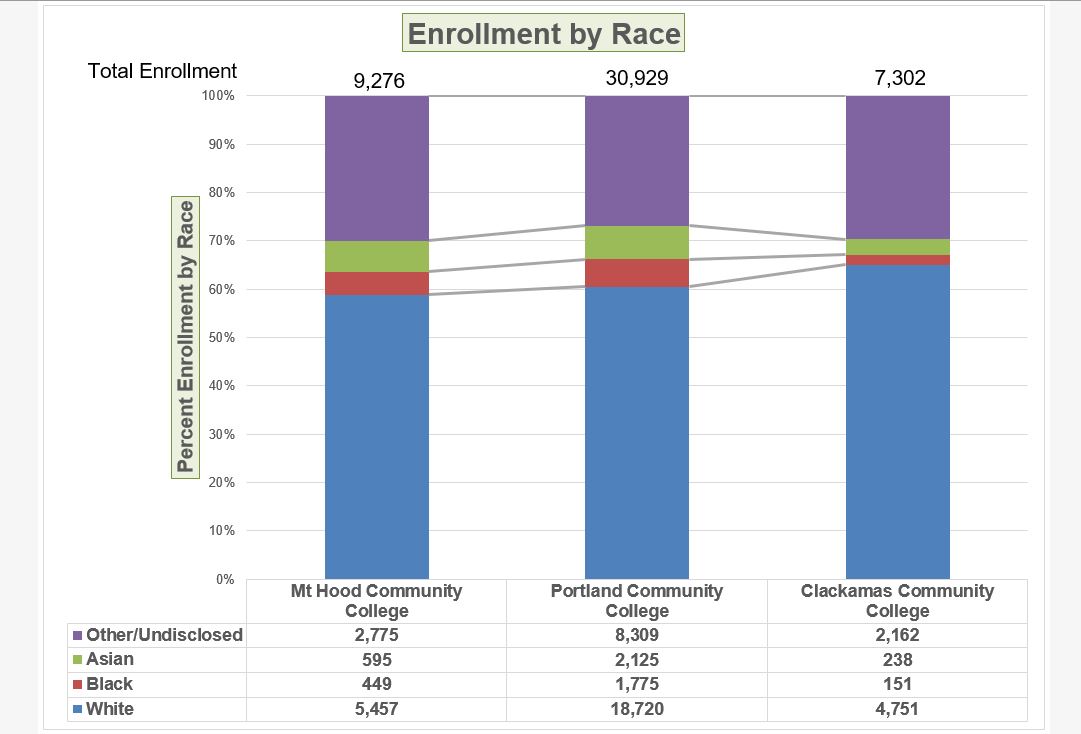
Excel charts can be valuable tools for explaining quantitative data in a written report. Reports that address business plans, public policies, budgets, and so on all involve quantitative data. For this example, we will assume that the Change in Enrollment Statistics Spend Source stacked column chart is being used in a student’s written report (see Figure 10.3.1).
The following steps demonstrate how to paste an image, or picture, of this chart into a Word document:
- Open CH4 Diversity. Save it as CH4 Diversity in Enrollment in Community Colleges
- Click below the figure heading in the Word document that reads: Figure 1: Enrollment by Race. The image of the stacked column chart will be placed below this heading.
- If needed, open the Excel file you have been working with (CH4 Charting). Activate the Enrollment by Race chart in the Enrollment by Race Chart sheet.
- Click the down arrow on the Copy button in the Home tab of the ribbon. Select Copy as Picture
- Select OK — Accepting the Copy Pictures defaults:
- As shown on Screen
- Picture
- Go back to the CH4 Diversity in Enrollment in Community Colleges Word document by clicking the file in the taskbar.
- Confirm that the insertion point is below the Figure 1: Enrollment by Race heading (see Figure 10.3.2) and click the Paste button in the Home tab of the ribbon ( or press Crtl-V).

Oh no!! The picture is so big that it falls on to the next page. We will need to change its size.
- Click anywhere on the picture of the chart to activate it.
- Click the Format tab under the Picture Tools section of the ribbon (see Figure 10.3.2).
- Click the down arrow on the Shape Width button in the Size group of commands. Continue to click the down arrow until the width of the picture is 5.4.” As you reduce the width of the picture, the height is automatically reduced as well. (The height should be ~ 3.92″)
- To center the chart on the page, make sure the chart is activated. Then go to the Home tab, to the Paragraph group, and select Center.
- Save your work.
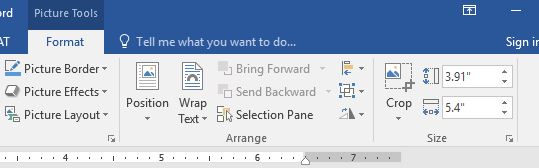
Figure 10.3.4 shows the final appearance of the Enrollment by Race Source chart pasted into a Word document. It is best to use either the Shape Width or Shape Height buttons to reduce the size of the chart. Using either button automatically reduces the height and width of the chart in proper proportion. If you choose to use the sizing handles to resize the chart, holding the SHIFT key while clicking and dragging on a corner sizing handle will also keep the chart in proper proportion.

Skill Refresher
Pasting a Chart Image into Word
- Activate an Excel chart and click the Copy button in the Home tab of the ribbon.
- Click on the location in the Word document where the Excel chart will be pasted.
- Click the down arrow of the Paste button in the Home tab of the ribbon.
- Click the Picture option from the drop-down list.
- Click the Format tab in the Picture Tools section of the ribbon.
- Resize the picture by clicking the up or down arrow on the Shape Width or Shape Height buttons.
Pasting a Linked Chart Image into PowerPoint
For this exercise you will need two files:
- The Excel spreadsheet you have been working in your Charts & Graphs chapter: CH4 Charting.
- A PowerPoint data file – CH4 Diversity.
Microsoft PowerPoint is perhaps the most commonly used tool for delivering live presentations. The charts used in a live presentation are critical for efficiently delivering your ideas to an audience. Similar to written documents, a wide range of presentations may require the explanation of quantitative data. This demonstration includes a PowerPoint slide that could be used in a presentation. We will paste the Enrollment by Race chart into this PowerPoint slide. However, instead of pasting an image, as demonstrated in the Word document, we will establish a link to the Excel file. As a result, if we change the chart in the Excel file, the change will be reflected in the PowerPoint file. The following steps explain how to accomplish this:
- Open CH4 Diversity.pptx. Save it as CH4 Diversity in Enrollment in Community Colleges.
- Navigate to Slide 6 – Diversity in Enrollment. This is the slide where you will place the linked chart.
- If needed, open the Excel file you have been working with (CH4 Charting). Activate the Enrollment by Race chart in the Enrollment by Race Chart sheet.
- Click the down arrow on the Copy button in the Home tab of the ribbon. Select Copy (not Copy as Picture.)
- Go back to the CH4 Diversity in Enrollment in Community Colleges presenation by clicking the file in the taskbar.
- Make sure you are still on Slide 6 – Diversity in Enrollment. Click on the outside edge of the empty prompt box on the right.
- Click the down arrow below the Paste button in the Home tab of the ribbon in the PowerPoint file.
- Hover over each of the Paste Options until you find Keep Source Formatting & Link Data (see Figure 10.3.5). Select this option. This pastes an image of the Excel chart into the PowerPoint slide. In addition, a link is created so that any changes made to the chart (in Excel) appear on the PowerPoint slide.

Next we need to make some changes to clean up the chart a bit. First, we are going to apply a different chart style.
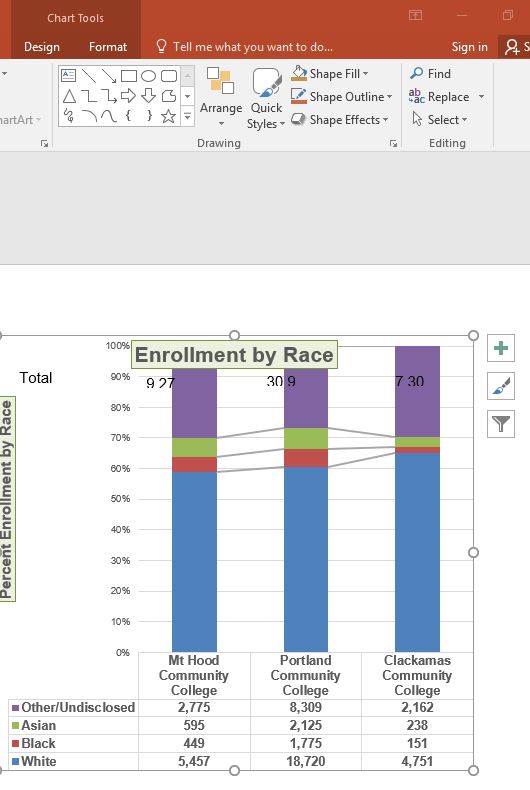
- Click anywhere in the plot area of the column chart pasted into the PowerPoint slide. You will see the same Excel Chart Tools tabs added to the ribbon (see Figure 10.3.6).
- On the Design tab, select Style 8 in the Chart Style group.
Paste linking this chart caused trouble with the text boxes we added, so next, we are going to delete them.
- Select each text box by clicking on the outside edge of the text box with the four-headed arrow. Press the delete key on your keyboard. Be sure that the insertion point is NOT blinking inside the text box. If it is, you will be editing the contents of the text box instead of deleting the actual text box.
The benefit of adding this chart to the presentation as a link is that it will automatically update when you change the data in the linked spreadsheet file.
- Return to your CH4 Charting Excel file.
- Select the Enrollment Statistics worksheet (the one with the Enrollment data.) Change the value in cell D3 to 1000. You have just changed the number of white students at Clackamas Community College to 1000. This isn’t true, but you want to change the data enough to see the effect in the charts.
- Select the Enrollment by Race Chart worksheet. Notice how the chart has changed.
- Return to the Diversity in Enrollment in Community Colleges PowerPoint file by clicking the file in the taskbar.
- On Slide 6, you should see the updated chart.
- If the chart has not changed; be sure that your chart is selected, click the Design tab in the Chart Tools section of the ribbon. Click the Refresh Data button. The change made in the Excel workbook is now reflected on the PowerPoint slide.
- If that still doesn’t work, you may have created a “normal” link — instead of a Paste Link. Delete the chart and follow the steps again. Start from the beginning of this section.
- Save your work for your records.
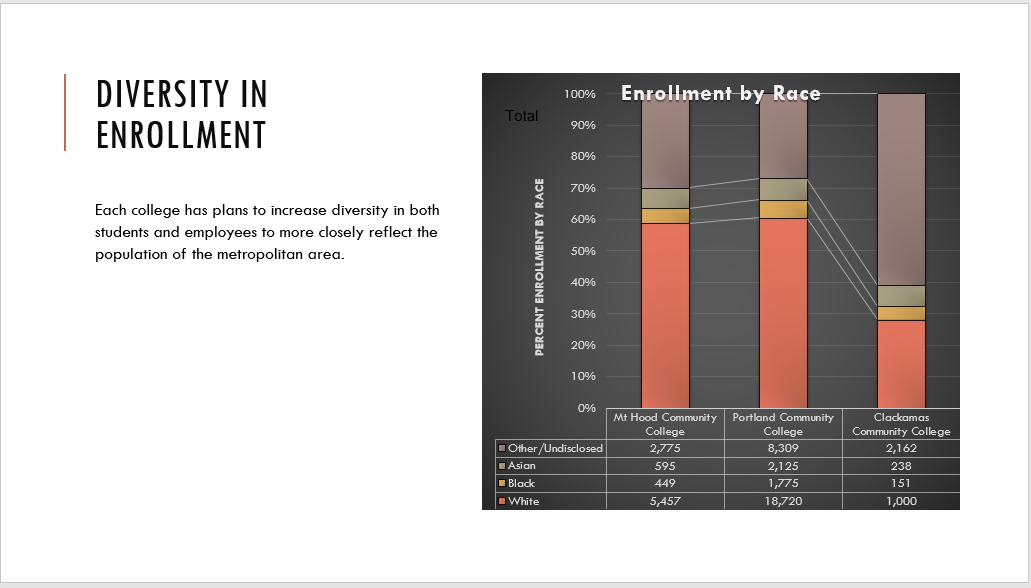
Figure 10.3.7 shows the appearance of the column chart after the change was made in the Enrollment Statistics worksheet in the Excel file. Note that the Data Chart at the bottom reflects the new number, too. The change that was made in the Excel file will appear in the PowerPoint file after clicking the Refresh Data button.
Integrity Check
Refreshing Linked Charts in PowerPoint and Word
When creating a link to a chart in Word or PowerPoint, you must refresh the data if you make any changes in the Excel workbook. This is especially true if you make changes in the Excel file prior to opening the Word or PowerPoint file that contains a link to a chart. To refresh the chart, make sure it is activated, then click the Refresh Data button in the Design tab of the ribbon. Forgetting this step can result in old or erroneous data being displayed on the chart.
Integrity Check
Severed Link?
When creating a link to an Excel chart in Word or PowerPoint, you must keep the Excel workbook in its original location on your computer or network. If you move or delete the Excel workbook, you will get an error message when you try to update the link in your Word or PowerPoint file. You will also get an error if the Excel workbook is saved on a network drive that your computer cannot access. These errors occur because the link to the Excel workbook has been severed. Therefore, if you know in advance that you will be using a USB drive to pull up your documents or presentation, move the Excel workbook to your USB drive before you establish the link in your Word or PowerPoint file.
Skill Refresher:
Pasting a Linked Chart Image into PowerPoint
- Activate an Excel chart and click the Copy button in the Home tab of the ribbon.
- Click in the PowerPoint slide where the Excel chart will be pasted.
- Click the down arrow of the Paste button in the Home tab of the ribbon.
- Click the Keep Source Formatting & Link Data option from the drop-down list.
- Click the Refresh Data button in the Design tab of the ribbon to ensure any changes in the Excel file are reflected in the chart.
Key Takeaways
- When pasting an image of an Excel chart into a Word document or PowerPoint file, use the Picture option from the Paste drop-down list of options – if you want the image to act as an image. You will not be able to make any changes to the content of the picture.
- When creating a link to a chart in Word or PowerPoint, you may need to refresh the data if you make any changes in the originating spreadsheet. You should not use the Picture option.
Attribution
Adapted by Noreen Brown from How to Use Microsoft Excel: The Careers in Practice Series, adapted by The Saylor Foundation without attribution as requested by the work’s original creator or licensee, and licensed under CC BY-NC-SA 3.0.
