
5.4 – Practice 4: Audible Data
Learning Objectives
- Recognize and explain table structure.
- Freeze rows and columns.
- Sort data in a table.
- Interpret Excel Table outputs.
“Audible is the world’s largest producer and provider of spoken-word entertainment and audiobooks, enriching the lives of our millions of listeners every day.” Amazon acquired Audible for $300 million in 2008 and today it offers its original productions in addition to audiobooks and podcasts. A benefit of Audible is that Amazon often offers discounted Kindle prices if you purchase both formats. As someone who enjoys both reading a book and having a book read to them, I often purchase both versions (and sometimes versions on other platforms just to show my appreciation for a title or author or narrator).
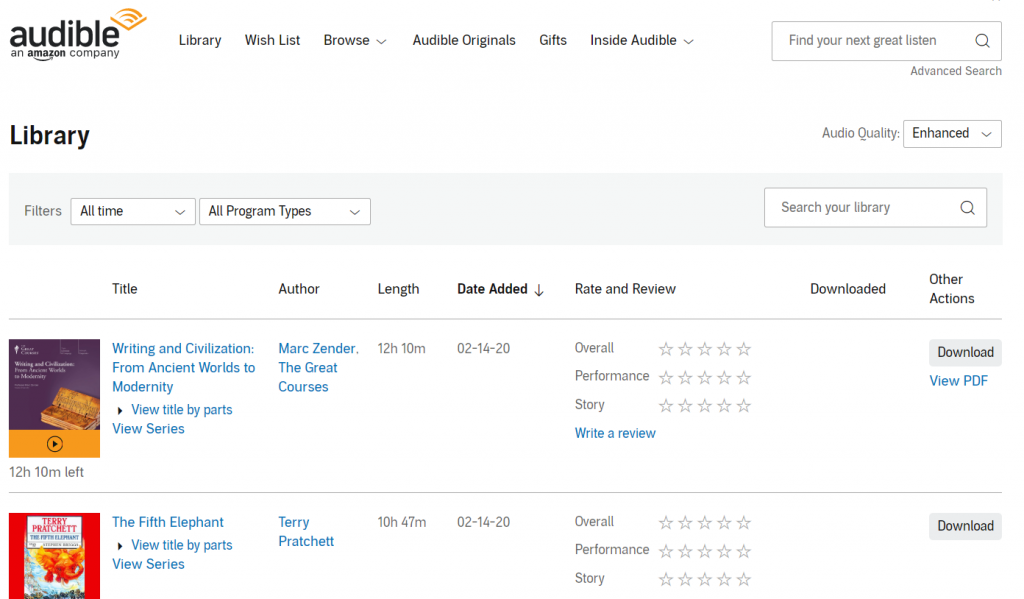
The screenshot above is from the author’s personal Audible library. It is provided here to illustrate the Audible interface and the types of data available for a customer upon login.
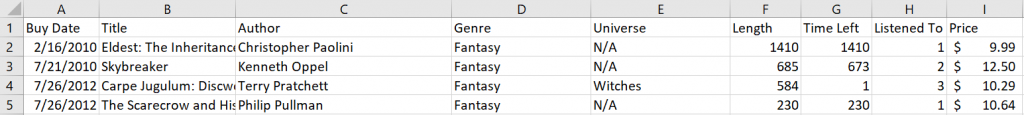
The image below shows an exported worksheet using default column headings (field names) from above such as Title, Author, Length, Date Added (edited to show Buy Date below) but expanded upon using Gustav Andersson’s Audible Statistics Extractor script and a copy+paste from a browser-based online interface into Excel. Length and Time Left fields were supplemented by field names such as Genre, Universe, and Listened To fields to be able to analyze a variety of category data. Using more complex categories allows us to run more comprehensive reports. Combining fields, sorting and filtering by multiple fields will help us narrow down our questions about our data even more.
A monthly Audible subscription costs $14.95, this price is usually a 30% off list-price of audiobooks you would buy without a subscription. Prices in the chapter practice data have been changed to random values so that we can manipulate them using the SUM and AVERAGE functions with a bit more depth. While library services like Overdrive or hoopla offer public library members free titles, Audible carries books and content not always available from free apps, so the cost is offset by a need this service fulfills.
As you create an Excel table from the simple range in your worksheet to look at reading/listening habits, consider how understanding a customer’s habits allows for a company to recommend titles in a way that may lead to greater customer satisfaction and the purchase of more titles. Analyzing a customer’s habits allow a company to recommend titles they will want to listen to. This, in turn, will allow the company to maintain a relationship with the customer who will keep their monthly subscription, upgrade, or purchase more titles.
Sort, Filter, & Slice the Data
The chapter 5 practice PR5 Audible Data file has only about 160 records. However, even in such a small data set, it can be difficult to find patterns just by looking at the text, dates, and numbers. Go to the Insert tab and use an Excel table to sort, filter, and rearrange the data to find out about favorites and listening habits.
- What is the listener’s favorite genre? How do you know?
- Who is their favorite author? Who is their second and third favorite? How do you know?
- What is their favorite book? What is your rationale for your answer?
- What types of books have they listened to multiple times? Is there a pattern there?
- What types of books have they not listened to at all? Why did they buy those then? ¯\_(ツ)_/¯
- What types of books would you recommend to this person? (Recommendations are welcome!)
Consider how you can scroll through a data set and you may be able to recognize patterns just by observing repeating items. However, it is much faster and more powerful to use Excel features and functions to see if there are connections, relationships, or patterns emerging from your data.
If you feel you need more guidance and need specific tasks to practice with, use the following steps to process the data set and answer questions below:
- Download the PR5 Audible Data file to your computer into your semester/class/chapter 5/ folder. Open and save as PR5 Audile Data – Your Name.xlsx
- Scroll through the file. While this is not a large file, it is already too long to see what patterns may be present. Therefore, we will insert a table to sort, filter, and slice our data.
- Insert a table based on =A1:I160 range. Excel will automatically select the range, you just need to confirm it and check that “My table has headers”.
- Insert a column next to Time Left. Rename it to Difference. We will use this column to find out which books the listener started, listened to a certain point at least, or finished. Combined with the “Listened To” column, we’ll know if they’ve listened to at all…
- In the Difference column, calculate the difference between Length and Time Left. Note that your formula will be =[@Length]-[@[Time Left]] because you are using an Excel table. This feature is known as a Calculated column and it’s a super convenient feature because we don’t even have to autofill a range anymore. The cell references that would normally appear when you build a formula will show up as the field names. This feature is called a structured reference and it makes it much easier to understand a cell or range reference.
- Now, sort the data by the Difference field from Largest to Smallest. What can we say about Sherlock Holmes and its characteristics we see in columns F, G, H, and I?
- Next, Custom Sort by multiple fields (Home tab > Editing OR Data > Sort & Filter) by the Difference column from Smallest to Largest AND the Listened To column Smallest to Largest. What do the values suggest in these two columns?
- Next, insert a Total Row at the bottom of your table. (Click into your table, then under the Design tab, select Total Row). Under the Genre column, select the COUNT function. How many titles are in this database altogether?
- Insert a Slicer from the Design tab based on the Genre field. Click the slicer buttons to filter the data by each genre. Is there a genre that is a clear favorite? Is there a second or third favorite? Is there a genre that has only a small amount of titles?
- Insert a Slicer from the Design tab based on the Universe field. Click the slicer buttons to filter the data by each field name. Is there a Universe that is a clear favorite? Is there a second or third favorite? Is there a genre that has only a small amount of titles?
- At the bottom of the Price column, select SUM in the Total Row. As you filter through the data, is there a category that the listener spent most on? Is there a category they did not spend as much on? What is the average spending per category?
- What types of books would you recommend to this Listener? Explain your reasoning based on the data.
Attribution
“5.5 Chapter Practice” by Emese Felvegi is licensed under CC BY 4.0.
