
4.4 Chapter Practice: U.S. EIA Crude Oil Imports
To assess your understanding of the material covered in the chapter, complete the following assignment.
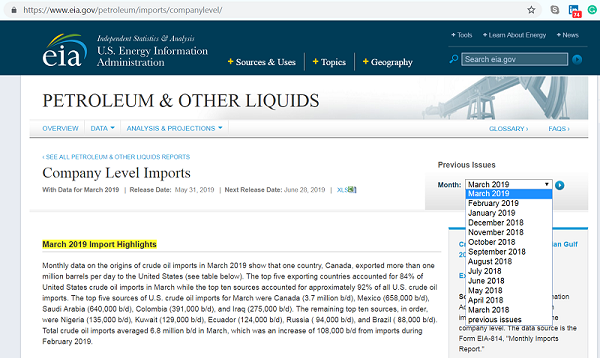
U.S. Energy Information Administration – crude oil imports
The data you will be working is from the U.S. Energy Information Administration (EIA) website. The EIA “collects, analyzes, and disseminates independent and impartial energy information to promote sound policymaking, efficient markets, and public understanding of energy and its interaction with the economy and the environment (Source: EIA.gov).” EIA content is often among the data sets that analysts with backgrounds in accounting, finance, supply chain, and management information systems work with in energy-related industries.
Step 1: Download the Ch4_Practice which is an archived copy of the EIA’s Company Level Imports page for March 2019 Import Highlights.
Step 2: Go to the EIA website to read a few of the brief summaries describing their data tables. Note how the summary matches the data points in the table below it. This is how data is generally reported on this website: they provide a summary of the data as a narrative, then they provide a table.
When you download the chapter practice file, your table will include the top ten countries and should have no countries listed below Brazil. Delete any countries if present.
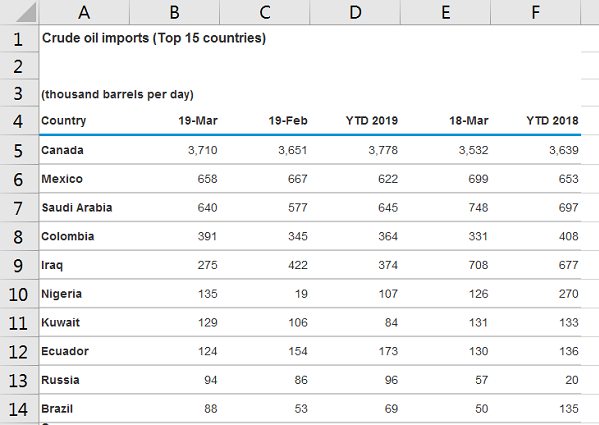
Step 3: Examine the simple formatting elements of the table used to illustrate the hierarchy of the data starting with the title, column headings, row headings, the use of borders, font-weight, and alignment. Observe the data type for 19-Mar, 19-Feb, etc.
Step 4: Rename your sheet to Crude Imports and save your file as Ch4_Practice_[YourInitials].xlsx.
Step 5: Type “Total” into A14. Calculate the Total for columns B through F. Which column has the highest/lowest totals? What does this mean? Observe how the import values change over time.
Step 6: Type “Average” into A15. Calculate the Average for columns B through F. Which column has the highest/lowest average? What does this mean? Observe how the import value averages change over time.
Step 7: Select non-adjacent ranges A3:A13 and D3:D13. Insert a 3-D Pie chart based on your selection. (Go to Insert > Charts > Pie Chart > 3-D Pie.)
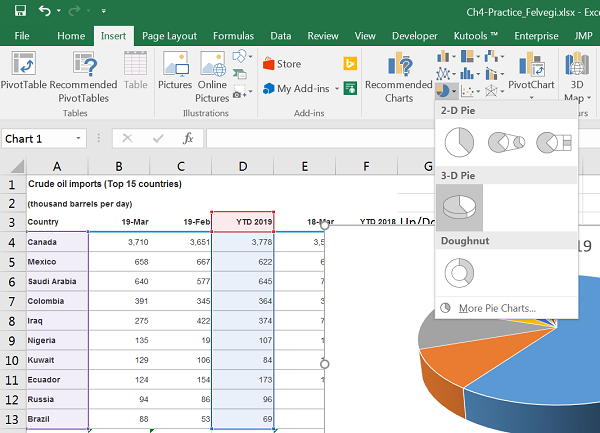
Step 8: Move your chart into a new sheet, change the name of the sheet to 3-D Pie.
Step 9: Add Data Callouts to show “Percentages” in the “Outside End” style. Observe the comparative percentages for the countries crude oil is imported from.
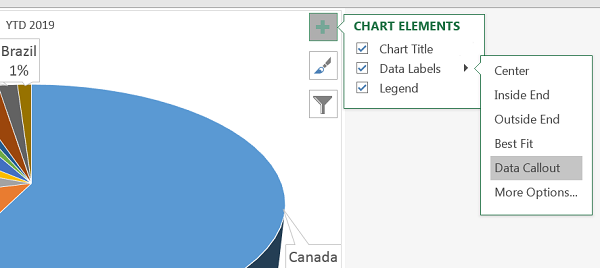
Step 10: Manipulate the type and placement of Chart elements. How can you make data for Nigeria, Kuwait, and Ecuador to read?
Step 11: Go back to your Crude Imports sheet. Change the value for Mexico to 900 from 622. Examine changes to percentage values in your pie chart.
Step 12: Save your work for your records, your chapter assessment will refer to this practice set.
Attribution
Practice problems by Emese Felvégi based on company level open data from EIA.gov. CC BY-NC-SA 3.0.
