
Excel Chapter 3 – Building More Complex Formulas
Excel workbooks are designed to allow you to create useful and complex calculations. In addition to doing arithmetic, you can use Excel to look up data, and to display results based on logical conditions. We will also look at ways to highlight specific results. These skills will be demonstrated in the context of a typical gradebook spreadsheet that contains the results for an imaginary Excel class.
In this chapter, we will:
- Use the Quick Analysis Tool to find the Total Points for all students and Points Possible.
- Write a division formula to find the Percentage for each student, using an absolute reference to the Total Points Possible.
- Write an IF Function to determine Pass/Fail – passing is 70% or higher.
- Write a VLOOKUP to determine the Letter Grade using the Letter Grades scale.
- Review common Error Messages using Smart Lookup to get definitions of some of the terms in your spreadsheet.
- Apply Data Bars to the Total Points values.
- Apply Conditional Formatting to the Percentage, Pass/Fail, and Letter Grade columns.
- Printing Review – Change to Landscape, Scale to Fit Columns on One Page and Set Print Area.
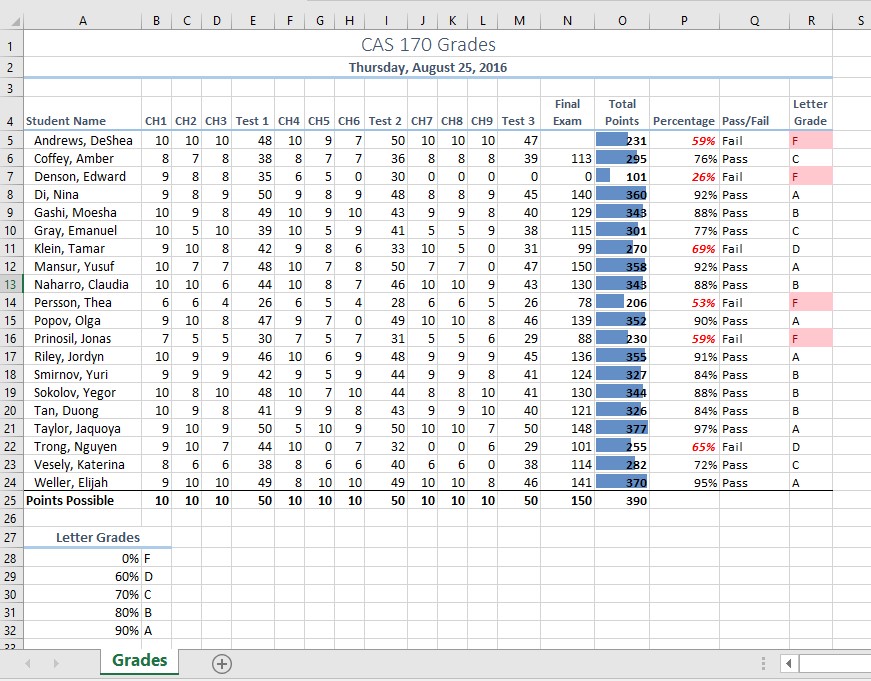
Figure 3-1 shows the completed workbook that will be demonstrated in this chapter for the Grades sheet in your Chapter data file.
Notice the techniques used in columns O and R that highlight the results of your calculations. Notice, also that there are more numbers on this version of the file than you will see in your original data file. These are all completed using Excel calculations.
Figure 3.1 Completed Gradebook Worksheet
The other examples for this chapter will be based on subsets of data files you continue to work with throughout the semester from the U.S. Department of Education and the U.S. Energy Information Administration.
Attribution
Chapter 3 – Formulas, Functions, Logical and Lookup Functions by Noreen Brown and Mary Schatz, PCC.EDU, is licensed under CC BY 4.0
