6.5.B Chapter Practice 2: CFPB Complaint Data
In this chapter, we are set to work with an Excel file called CFPB_Truncated_Complaints. Your Blackboard quiz will use a different subset of data you will download from Blackboard. Complete this guided practice first BEFORE attempting the one attempt quiz on Blackboard. Practice, practice, practice.
Let’s start with the context because having a general understanding of what we will find in the data will allow us to process it faster.
Answer the following questions:
- What does the file name reveal? What is CFPB? What do you know of its work?
- What kinds of complaints do you expect to find in a file from the CFPB?
- Next, open the data file. What is the source? Have there been any edits made to it?
- Note how the data file has been downsized to a specific year, quarter. What does it suggest of the total file size that a quarter alone makes up so many records?
- Is there a data dictionary? Do the field names make sense without one? What can you do if there is no data dictionary?
- How much data is in the workbook? How many fields? How many records? How many cells with contents?
- What types of questions can you answer with the data?
- What functions do you know in Excel that will help you process data?
EXERCISES
Answer the following questions using a variety of features and functions in Excel. A variety of solutions are shown in the section below. Try to answer these questions independently and check your answers against other
- What date was complaint 2845603 received?
- What product is the complaint with the ID number of 2770577 is regarding?
- Which Product has the most complaints? Which has the least?
- Which sub-product has the most complaints? The least?
- How many complaints are there about virtual currency?
- The highest volume of complaints is submitted via… The lowest?
- In the state of Texas, which Company are there the most complaints about?
- What does the following output reveal?
Solutions:
- Complaint 2845603 was received 3/16/2018.
> Scroll OR CTRL+F OR filter an Excel table. - Complaint ID number 2770577 was regarding a Mortgage product.
> Scroll OR CTRL+F OR filter an Excel table. - Credit reporting, credit repair services, or other personal consumer reports has the most complaints. Money transfer, virtual currency, or money service has the least.
> Use Subtotals in a range OR create a PivotTable. - The Credit reporting sub-product has the most complaints. There are 5 products with one complaint each.
> Use Subtotals in a range OR create a PivotTable. - There are 48 complaints about virtual currency.
> Filter an Excel table OR search your PivotTable from the last step OR filter a new PivotTable. - The highest volume of complaints is submitted via Web. The lowest via Postal mail.
> Use Subtotals in a range OR create a PivotTable. - In the state of Texas, EQUIFAX, INC. is the company with the most complaints. There are several companies with only one complaint.
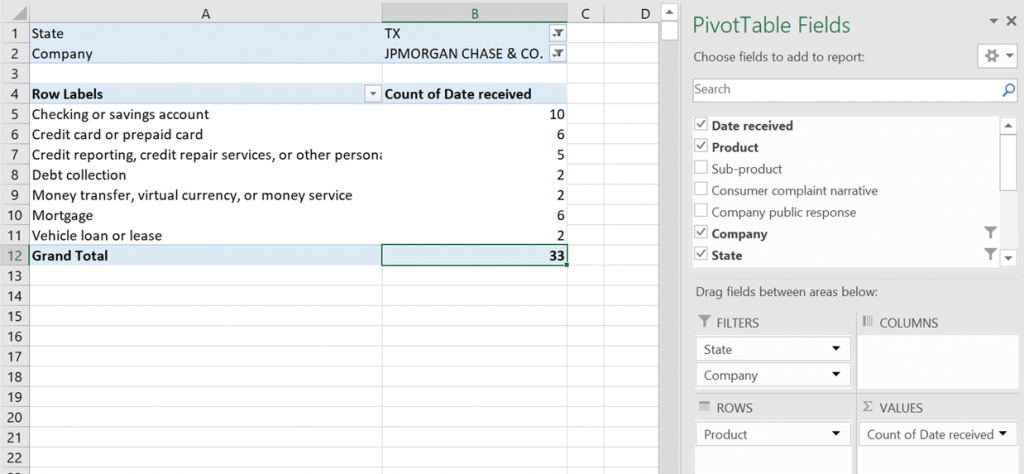
> Filter an Excel table OR filter a PivotTable. - The output shows the complaints about JPMorgan Chase in the state of Texas.
> The pivot table filters the number of complaints for each Products by State and Company.
Now, with 100% more charts!
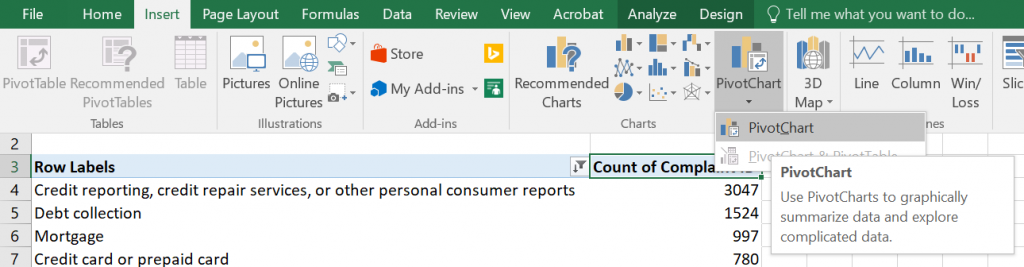
Let’s build on our knowledge from Chapter 4 about charts, graphs, and data visualization to create even more powerful summary data to tell a story based on our numbers. The PivotChart below summarizes over 7,600 pieces of data and it depends on Excel’s ability to condense all of those numbers into a simple visual feature in a way that a standard chart couldn’t.
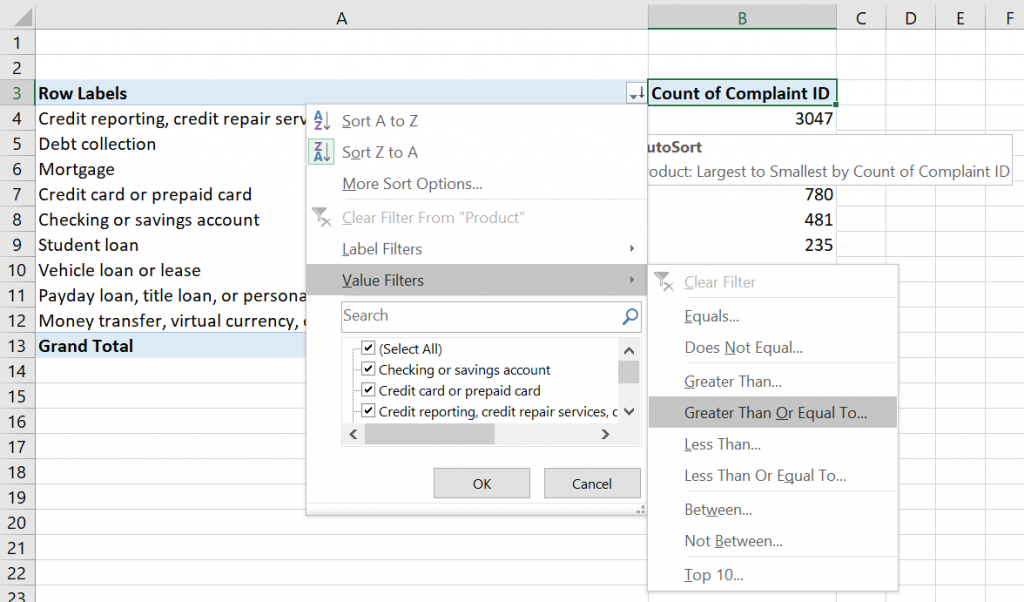
If we want to show only a subset of our data, we can filter from the PivotTable end as shown below:
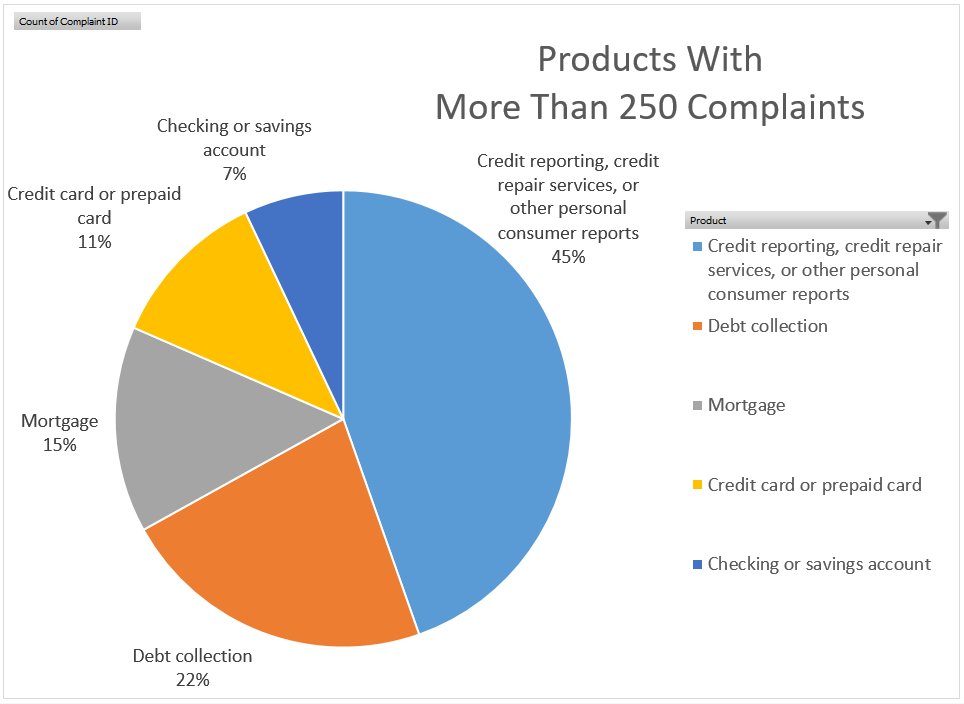
Alternatively, we can filter from the PivotChart side as well by using the Filter inside the chart area and unchecking items we don’t wish to include. We also use the Labels to add values and show percentages to compare the relative volume of complaints about each product that met the criteria for the number filter.
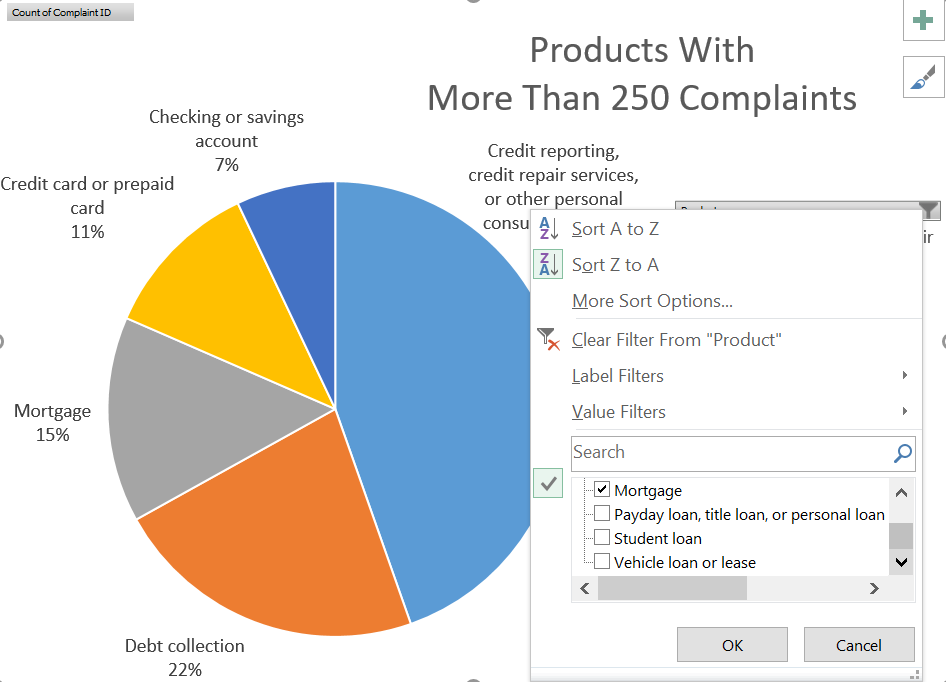
Can you write a summary sentence based on the chart below?