
2.4 Sorting Data
Sorting Data (Multiple Levels)
Data file: Continue with CH2 Personal Budget.
The Budget Detail worksheet shown in Figure 2.26 is now producing several mathematical outputs through formulas and functions. The outputs allow you to analyze the details and identify trends as to how money is being budgeted and spent. Before we draw some conclusions from this worksheet, we will sort the data based on the Percent of Total column. Sorting is a powerful tool that enables you to analyze key trends in any data set. Sorting will be covered thoroughly in a later chapter, but will be briefly introduced here. For the purposes of the Budget Detail worksheet, we want to set multiple levels for the sort order. This is accomplished through the following steps:
- Highlight the range A2:F11 in the Budget Detail worksheet.
- Click the Data tab in the Ribbon.
- Click the Sort button in the Sort & Filter group of commands. This opens the Sort dialog box, as shown in Figure 2.27.
- Click the down arrow next to the “Sort by” box.
- Click the Percent of Total option from the drop-down list.
- Click the down arrow next to the sort Order box.
- Click the Largest to Smallest option.
- Click the Add Level button. This allows you to set a second level for any duplicate values in the Percent of Total column.
- Click the down arrow next to the “Then by” box.
- Select the LY Spend option. Leave the Sort Order as Smallest to Largest
- Click the OK button at the bottom of the Sort dialog box.
- Save the Ch2 Personal Budget file.
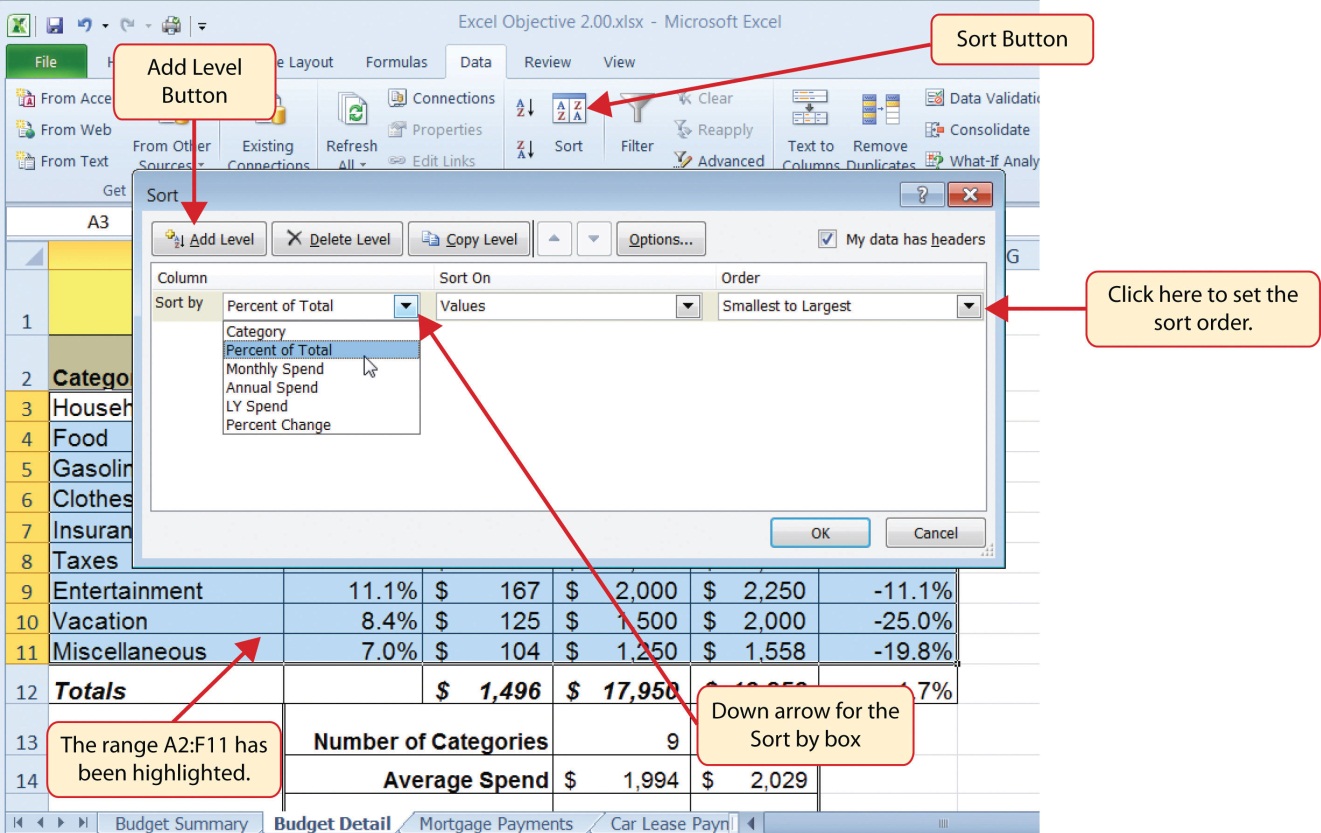
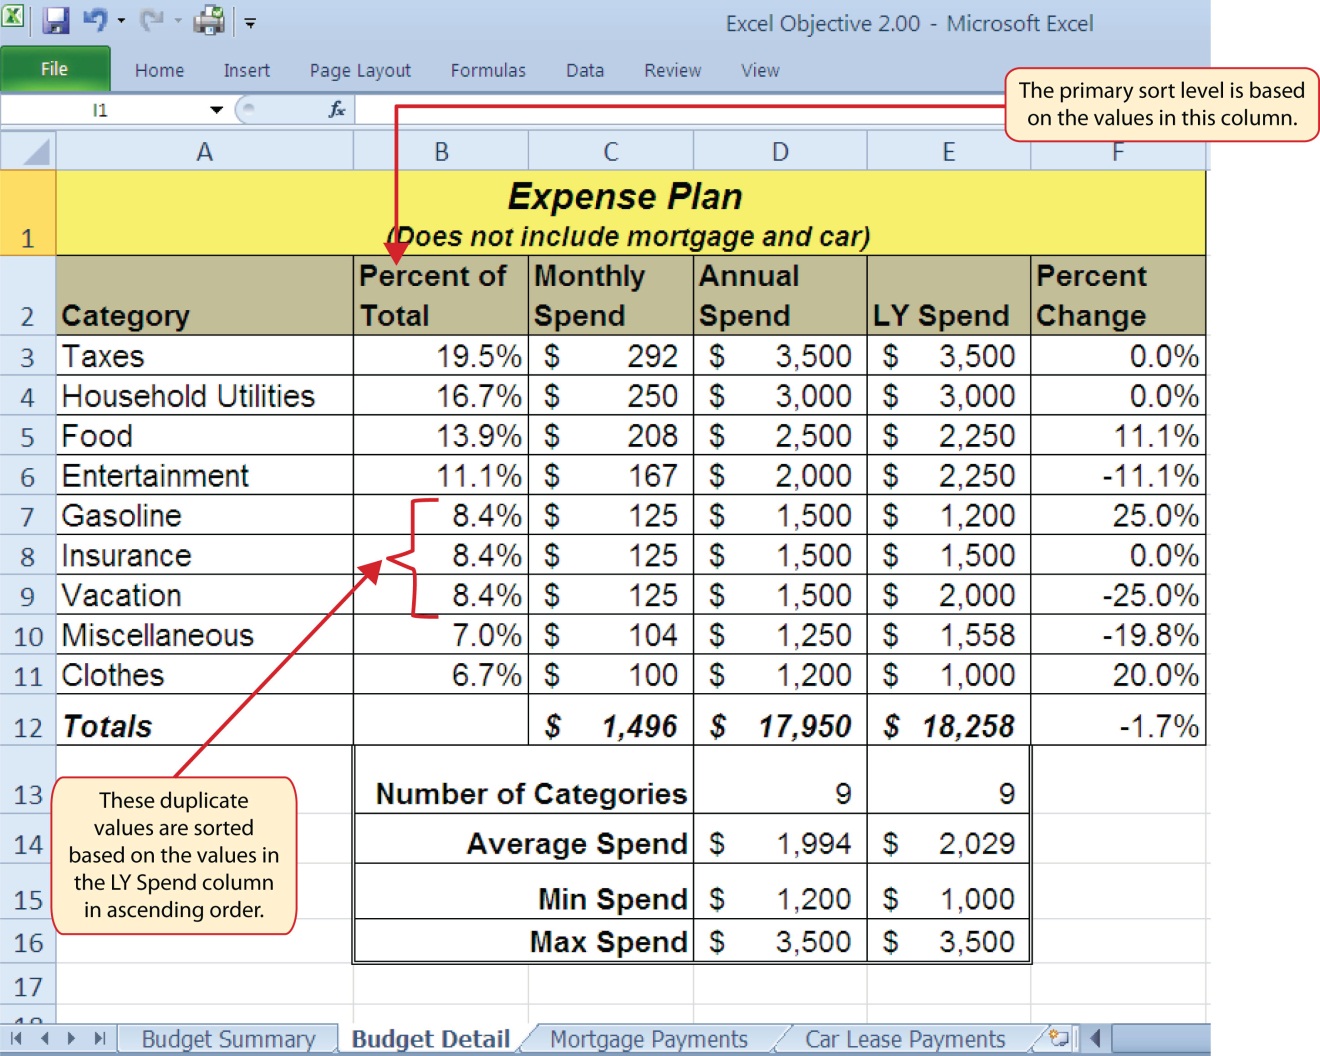
Figure 2.28 shows the Budget Detail worksheet after it has been sorted. Notice that there are three identical values in the Percent of Total column. This is why a second sort level had to be created for this worksheet. The second sort level arranges the values of 8.4% based on the values in the LY Spend column in ascending order. Excel gives you the option to set as many sort levels as necessary for the data contained in a worksheet.
Skill Refresher
Sorting Data (Multiple Levels)
- Highlight a range of cells to be sorted.
- Click the Data tab of the Ribbon.
- Click the Sort button in the Sort & Filter group.
- Select a column from the “Sort by” drop-down list in the Sort dialog box.
- Select a sort order from the Order drop-down list in the Sort dialog box.
- Click the Add Level button in the Sort dialog box.
- Repeat Steps 4 and 5.
- Click the OK button on the Sort dialog box.
Now that the Budget Detail worksheet is sorted, a few key trends can be easily identified. The worksheet clearly shows that the top three categories as a percentage of total budgeted spending for the year are Taxes, Household Utilities, and Food. All three categories are necessities (or realities) of life and typically require a significant amount of income for most households. Looking at the Percent Change column, we can see how our planned spending is expected to change from last year. This is perhaps the most important column on the worksheet because it allows you to assess whether your plan is realistic. You will see that there are no changes planned for Taxes and Household Utilities. While Taxes can change from year to year, it is not too difficult to predict what they will be. In this case, we are assuming that there are no changes to the tax costs for our budget. We are also planning no change in Household Utilities. These costs can fluctuate from year to year as well. However, you can take measures to reduce costs, such as using less electricity, turning off heat when no one is in the house, keeping track of your wireless minutes so you do not go over the maximum allowed in your plan, and so on. As a result, there is no change in planned spending for Household Utilities because we will assume that any rate increases will be offset with a decrease in usage. The third item that is planned not to change is Insurance. Insurance policies for cars and homes can change, but as is true for taxes, the changes are predictable. Therefore, we are assuming no changes in our insurance policy.
The first big change that is noticeable in the worksheet is the Food and Entertainment categories in rows 5 and 6 (see definitions in Table 2.1). The Percent Change column indicates that there is an 11.1% decrease in Entertainment spending and an 11.1% increase in Food spending. This is logical because if you plan to eat in restaurants less frequently, you will be eating at home more frequently. Although this makes sense in theory, it may be hard to do in practice. Dinners and parties with friends may be tough to turn down. However, the entire process of maintaining a budget is based on discipline, and it certainly takes a significant amount of discipline to plan targets for yourself and stick to them.
A few other points to note are the changes in the Gasoline and Vacation categories. If you commute to school or work, the price of gas can have a significant impact on your budget. It is important to be realistic if gas prices are increasing, and you should reflect these increases in your budget. To compensate for the increased spending for gas, the spending plan for vacations has been reduced by 25%. Budgeting often requires a certain degree of creativity. Although the Vacation budget has been reduced, there is still money you can set aside to make plans for spring break or winter break.
Finally, the budget shows a decrease in Miscellaneous spending of 19.8%. This was defined as a group containing several expenses, such as textbooks, school supplies, software updates, and so on (see Table 2.1). You may be able to reduce your spending in this category if you can use items such as online textbooks. This reduction in spending can free up funds for Clothes, a spend category that has increased by 20%. We will continue to develop the Personal Budget workbook further in Section 2.3 “Functions for Personal Finance”.
Key Takeaways
- Statistical functions are used when a mathematical process is required for a range of cells, such as summing the values in several cell locations. For these computations, functions are preferable to formulas because adding many cell locations one at a time to a formula can be very time-consuming.
- Statistical functions can be created using cell ranges or selected cell locations separated by commas. Make sure you use a cell range (two cell locations separated by a colon) when applying a statistical function to a contiguous range of cells.
- To prevent Excel from changing the cell references in a formula or function when they are pasted to a new cell location, you must use an absolute reference. You can do this by placing a dollar sign ($) in front of the column letter and row number of a cell reference.
- The #DIV/0 error appears if you create a formula that attempts to divide a constant or the value in a cell reference by zero.
- The Paste Formulas option is used when you need to paste formulas without any formatting treatments into cell locations that have already been formatted.
- You need to set multiple levels, or columns, in the Sort dialog box when sorting data that contains several duplicate values.
Attribution
Adapted by Mary Schatz from How to Use Microsoft Excel: The Careers in Practice Series, adapted by The Saylor Foundation without attribution as requested by the work’s original creator or licensee, and licensed under CC BY-NC-SA 3.0.
