
5.4 – Practice 3: Airfare Data
Learning Objectives
- Recognize and explain table structure.
- Freeze rows and columns.
- Sort data in a table.
- Interpret Excel Table outputs.
In this chapter practice, we will work with an Excel file called USDOT_Consumer_Airfare_2007-2017. In order to learn a bit more about what we should expect in the file, let’s break down the file name.
What is USDOT?
Our data is from the U.S. Department of Transportation’s website. “The mission of the U.S. Department of Transportation (DOT) is to ensure our Nation has the safest, most efficient and modern transportation system in the world, which improves the quality of life for all American people and communities, from rural to urban, and increases the productivity and competitiveness of American workers and businesses.“
What do we know about the airline industry?
From KPMG’s Aviation Leaders Industry Report 2020: “With oil prices relatively stable and the low interest rate environment continuing, the aviation industry continues to enjoy a record period of profitability. 2019 represented the tenth consecutive year of global airline profitability ($25.9bn) and it was the fifth highest on record. In a sector where business cycles typically last eight or nine years from peak to peak, we are in uncharted territory. Passenger traffic continues to grow (4.2% RPK growth in 2019) and IATA expects this supercycle to continue into 2020 for a record eleventh year.
However, all is not rosy in the garden. While the headline figures for 2019 are positive, they represent a decline from 2018 where profits stood at $27.3bn and RPK growth was 7.4%. We have also seen a spike in airline bankruptcies during the year. The consensus of the industry leaders interviewed for this report is that the cycle has peaked, and a slow downturn has commenced. Our report last year focused on significant headwinds such as the volatile geopolitical environment, slowing economies, rising interest rates, a strong US dollar, increasing production rates and capacity constraints. […]”
News about the aviation industry:
- Deutsche Welle: AeroData software outage delays hundreds of US regional flights
- Financial Times (UK): Boeing is dragging down American growth (login with your CougarNet account)
- Forbes.com: Could Coronavirus Really Wipe Out Half The World’s Airlines And Change Aviation Forever? One Keen Observer Thinks So.
- Statista.com: Domestic market share of leading U.S. airlines from January to December 2019*
- Vox.com: How the coronavirus outbreak is affecting travel
Let’s look at the file itself and the Info sheet in the workbook!
Download the USDOT_Consumer_Airfare_2007-2017. Use the right-click + Save As route, do not try to open the file directly from the textbook. Our data file is going to show us data from 2007 to 2017. We can generally use multi-year data to see if we can spot trends or patterns.
- How big is the data file? > Is its size measured in kilobytes, megabytes or gigabytes? Why does this matter?
- Is there a data dictionary? > Read it! What can we learn about the data based on it? What can we do with field names that do not make sense when we read them?
- What is the source of your data? > What can we do if there is no source noted?
- Do we know who collected the data? > Do we know why? If not, then what?
- What is its purpose of this data? > Does the source say what the purpose of this file is? If they do not, then what should we do?
- Is there a data dictionary linked? Open it, compare the data to it.
- Do you like the structure and the colors of the data dictionary? > If you do not, what can you do?
Let’s look at the Consumer_Airfare_Report sheet!
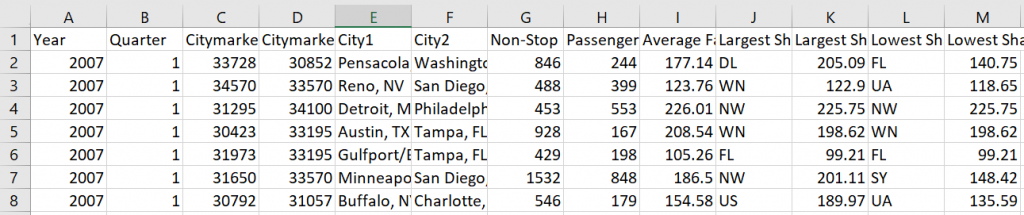
- How much data is in the file? > Highlight the full range using CTRL+SHIFT+RIGHT KEY, DOWN KEY, how many cells are highlighted?
- How many field names (columns)?
- How many records (rows)?
- Do the field names make sense?
- What types of questions can you answer with the data?
- What functions do you know in Excel that will help you process data?
How would you process this data?
Use multiple methods of finding the correct answers!
- Can you find a specific value? > Any shortcuts?
- How do you add up the Passengers/Day? > Functions? Total Row? PivotTable?
- How do you count Carriers? > Functions? Total Row? PivotTable?
- How do you average Non-Stop Miles? > Functions? Total Row? PivotTable?
- How do you find the highest and lowest values? > Sort in what order?
- How do you show only a subset of your data? > Excel Table? PivotTable?
SAMPLE QUESTIONS
1. What is the Citymarket code for Houston?
a. 31453
b. 2975
c. 3314
d. 2853
2. The highest Non-Stop Miles trip is ______ miles.
a. 3526
b. 2825
c. 2724
d. 3679
3. The highest Largest Share Carrier Fare is ______ (change to accounting number format, round to 0 decimals).
a. $560
b. $480
c. $420
d. $530
4. The highest Largest Share Carrier Fare where City 1 is Houston is ______ (change to accounting number format, round to 0 decimals).
a. $513
b. $298
c. $392
d. $458
5. Add a calculated column in N, call it $. Add a formula to multiply Passengers/Day by Average Fare. What formula does your cell contain?
a. =[@[Passengers/Day]]+[@[Average Fare]]
b. =[@[Passengers/Day]]*[@[Average Fare]]
c. =[@[Passengers/Day]]-[@[Average Fare]]
d. =[@[Passengers/Day]]/[@[Average Fare]]
6. Based your answer above and the BTS Airline Codes list, which airline has the lowest value in column N?
a. United Airlines
b. Northwest Airlines
c. Spirit Airlines
d. Delta Airlines
7. How many records are there that meet the following criteria: Non-Stop Miles less than 200, average Passengers/Day greater than 1000?
a. 39
b. 34
c. 41
d. 26
8. What is the lowest share carrier average in 2013 in quarter 4 in Austin, Texas (City 2)?
a. 188.24
b. 195.12
c. 183.52
d. 173.73
9. What is the % of Grand Total for Passengers a Day in Chicago,IL(City 2) for DL airline?
a. 32.07%
b. 31.82%
c. 22.57%
d. 27.96%
10. What is the % of Grand Total for Passengers a Day in New York City, NY (Metropolitan Area) (City 1) for CO airline?
a. 6.94%
b. 7.93%
c. 5.73%
d. 4.13%
